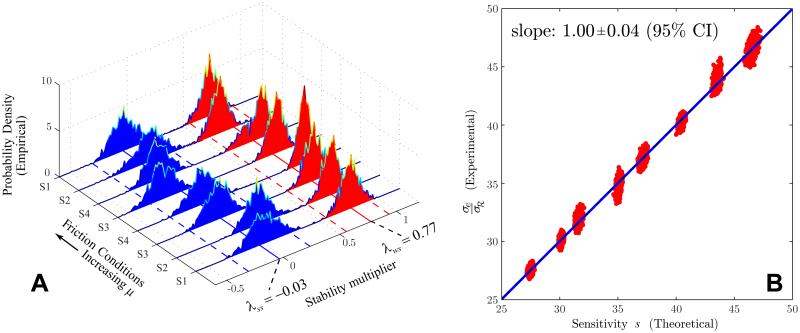
Figure 6.
Results for the shuffleboard experiment for all subjects and friction conditions. (A) Stability multipliers (eigenvalues of B as in Eq. 15) estimated from fluctuation time series: the strongly stable eigenvalue (blue probability densities) is near zero and corresponds to an eigenvector that is transverse to the GEM, whereas the weakly stable eigenvalue (red probability densities) is close to 1 and corresponds to an eigenvector nearly tangent to the GEM. The probability densities were estimated using a bootstrapping technique. Dashed blue and red lines indicate 5 and 95 percentiles for all subjects/conditions. (B) Scaling behavior of normalized task performance, showing dominant effect of passive sensitivity: σe/σℛ = s to high accuracy, where s is the singular value of the body-goal matrix A for the goal function (Eq. 18). Red dots indicate bootstrapping estimates from data for all 8 subjects/conditions, blue line is from regression.

