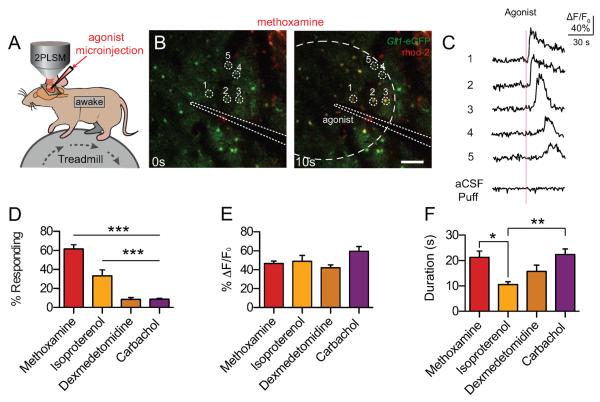
Fig. 1.
Astrocytes respond to α1- and β-AR agonists with increases in intracellular Ca2+. (A) Cortical astrocytes loaded with rhod-2 (AM) were imaged in layers I/II to detect changes in [Ca2+]i. Agonists were injected using a microelectrode loaded with ACSF and the tracer Alexa 488. (B) Representative images of astrocytic [Ca2+]i responses to the α1-AR agonist, methoxamine, in awake Glt-1-eGFP transgenic mice. Astrocyte-specific loading of rhod-2 (AM) was confirmed by colocalization with Glt-1-eGFP. Scale bar = 100μM. (C) rhod-2 (AM) ΔF/F0 traces from (B), normalized to Glt-1-eGFP fluorescence. Representative aCSF-microinjection trace at the bottom. (D) Astrocytic [Ca2+]i responses to adrenergic and acetylcholinergic receptor agonists, measured by rhod-2 (AM) ΔF/F0. Bar graph showing the percent of astrocytes within the puff radius responding with a [Ca2+]i increase. *** p<0.001, one-way ANOVA, Bonferroni correction; [n= 25 trials in 6 animals (methoxamine); 14 trials in 4 animals (isoproterenol); 24 trials in 5 animals (dexmedetomidine); 23 trials in 5 animals (carbachol)] (E and F) Bar graphs showing average rhod-2 (AM) ΔF/F0 and response duration from trials with responding cells. ** p < 0.01; * p < 0.05, one-way ANOVA, Bonferroni correction; [n = 25 trials (methoxamine), 13 trials (isoproterenol), 17 trials (dexmedetomidine), 20 trials (carbachol).] Data are shown as mean ± SEM.

