Fig. 2.
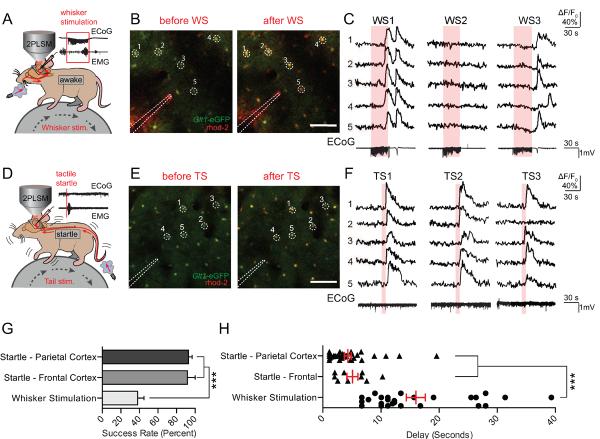
Astrocytes respond reliably to startle stimulation with widespread Ca2+ waves. (A) Astrocytic Ca2+ transients measured by rhod-2 (AM) were detected in response to 30s of 3Hz whisker stimulation. Representative LFP and EMG recordings are shown. (B) Representative images of rhod-2 (AM) fluorescence increases during whisker stimulation in a Glt-1-eGFP animal. Scale bar = 100μM. (C) Selected cells from (B). rhod-2 ΔF/F0 was normalized to Glt-1-eGFP fluorescence. ECoG traces corresponding to rhod-2 ΔF/F0 are shown below. (D) Air pulses were directed at the face or tail of the animal to elicit a startle response. Representive ECoG and EMG traces are shown with no apparent evoked ECoG response, and strong EMG activity – indicative of a startle response. (E and F) Representative images and corresponding rhod-2 dF/F0 traces show stable and repeatable astrocytic [Ca2+]i transients after startle stimulations. Bottom, representative ECoG traces from startle stimulation are shown. (G) Bar graph showing the response rate of cortical astrocytes to whisker and startle stimulation, averaged across animals. *** p<0.001, one-way ANOVA, Bonferroni correction; [n = 11 animals (parietal cortex startle and whisker stimulation), 4 animals (frontal cortex startle)] (H) Scatter diagram with superimposed mean and SEM for the delay from the onset of whisker/startle stimulation to the beginning of astrocytic rhod-2 ΔF/F0 responses. Average delay from each successful trial is shown. *** p<0.001, one-way ANOVA, Bonferroni correction; [n= 28 trials in 14 animals (whisker stimulation), 38 trials in 13 animals (parietal cortex startle), and 9 trials in 4 animals (frontal cortex startle)]. Data are shown as mean ± SEM.

