Fig. 3.
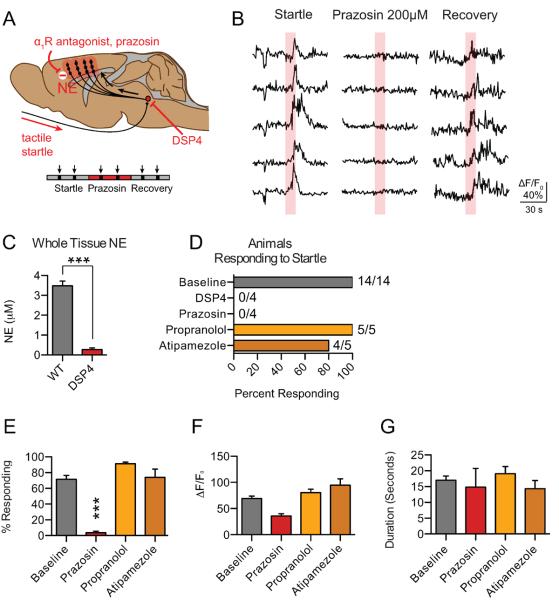
Astrocytic Ca2+ responses are dependent upon activation of the α1-AR. (A) Schematic illustrating diffuse NE release from the LC across the cortex in response to startle stimulation. LC-specific neurotoxin DSP4 and prazosin are shown blocking astrocytic Ca2+ responses, as measured by rhod-2 ΔF/F0. (B) Representative traces of astrocytic rhod-2 ΔF/F0 before, during, and after application of the α1-AR antagonist prazosin. (C) Bar graphs of cortical NE content in whole brain homogenate determined by HPLC showing depletion following DSP-4 injection. *** p<0.001, unpaired, two-tailed t-test [n=5 animals per group]. (D) Histogram presenting the percent of animals exhibiting at least one response to startle stimulation (>1/3 of cells exhibiting a rhod-2 ΔF/F0 response) for DSP4 and adrenergic antagonist treated animals. (E) Bar graph showing the average percent of cells responding with an increase in rhod-2 ΔF/F0 in the imaging field *** p<0.001, paired t-test; [prazosin: 20 trials baseline, 16 trials with drug in 4 animals; atipamezole: n = 13 trials baseline, 13 trials with drug in 5 animals; propranolol: 14 trials baseline, 14 trials with drug in 5 animals.] (F and G) Bar graphs showing the average peak amplitude increase in astrocytic rhod-2 ΔF/F0 and the duration of the response, presented as the average responses from each trial with at least 1 cell responding. paired t-test; [n = 13 trials baseline, 4 trials with drug (prazosin); 13 trials baseline, 11 trials with drug (atipamezole); 14 trials baseline, 14 trials with drug (propranolol)] Baseline data are presented as a pooled average. Data are shown as mean ± SEM.

