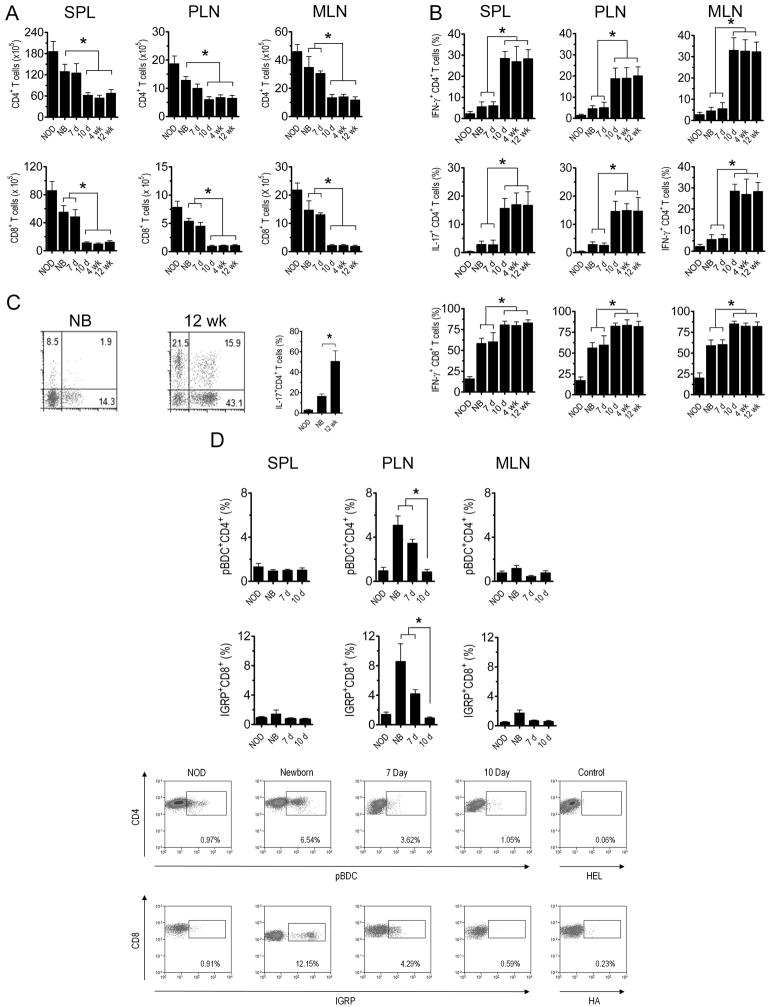
Figure 2. Distinct T cell phenotypes and specificities detected in recipients of different aged NOD donor thymi.
The spleen, PLN and MLN of different aged NOD thymus recipients 8 wk-post implantation and control 12 wk-old intact NOD female mice (NOD) were assessed via FACS for (A) CD3+CD4+ and CD3+CD8+ T cell numbers (n=7; *p<10-2; Student’s t test), (B) the frequency of intracellular IFNγ and IL-17 expressing CD4+ and CD8+ T cells (n=7; *p<0.005; Student’s t test). (C) Representative FACS plots (left and center) and frequency of IL-17 producing T cells isolated from the large intestines of newborn and 12 wk-old thymus recipients; gated on CD3+CD4+ T cells (n=7; *p<0.05; Student’s t test). (D) The frequency of IAg7-pBDC-binding CD4+ T cells and H2Kd-IGRP-binding CD8+ T cells with representative FACS plots from PLN isolated cells; gated on CD3+ and CD4+ or CD8+ T cells respectively (n=5; *p<0.05; Student’s t test). Error bars represent SEM.

