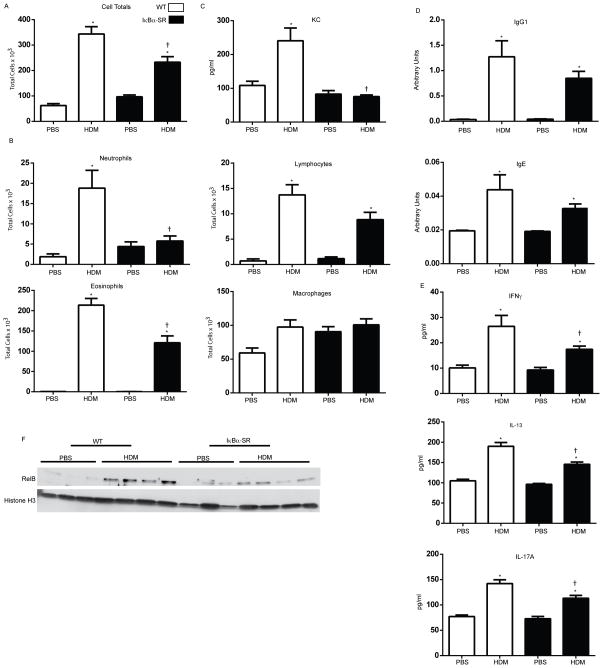
Figure 4. Assessment of HDM-induced inflamation, immunoglobins, T-cell cytokines, and nuclear RelB in WT or CC10-NF-κBSR mice following 15 challenges with HDM.
Assessment of (A) total cells and differential cell counts (B) and KC levels(C) in BAL. (D) Total IgG1 and IgE in serum. (E) IFNγ, IL-13, and IL-17A in homogenized tissue by ELISA. (F) Nuclear content of RelB in homogenized lung tissue. Histone H3 is shown as a loading control. Data represents 8 mice/group/time point. * p< 0.05 (ANOVA) compared to the PBS group at the same time point. † p<0.05 (ANOVA) compared to WT mice exposed to HDM.

