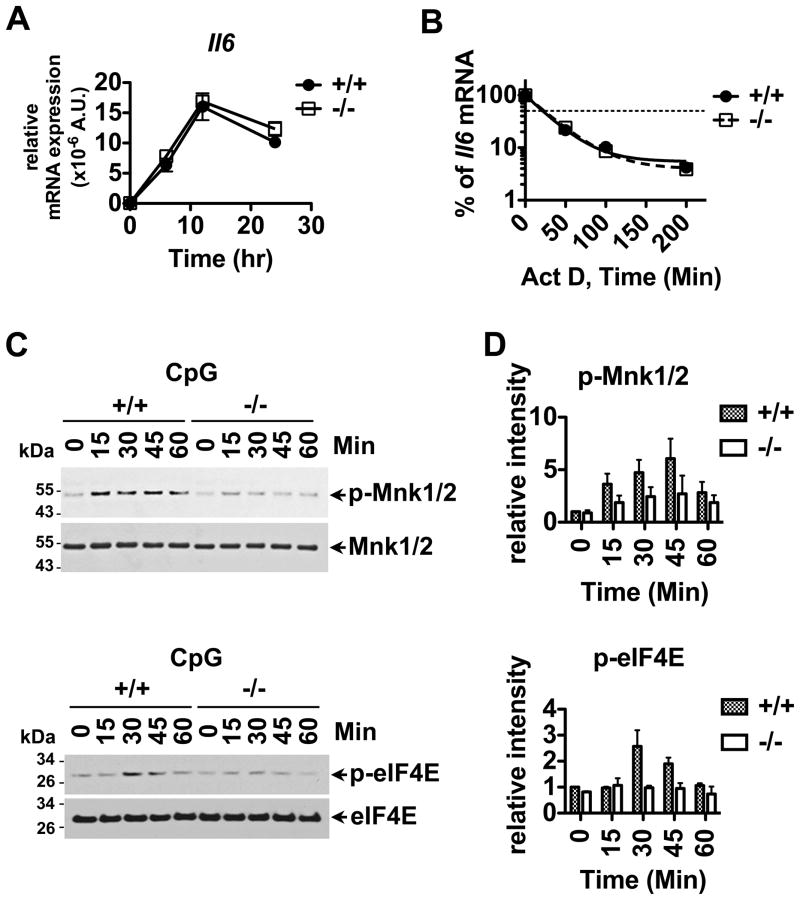
Figure 4. Reduced IL-6 secretion can be attributed to downregulation of the phosphorylation of the p38-MNK1/2-eIF4E cascade in Bank1−/− B cells following CpG stimulation and not to Il6 gene transcription and Il6 mRNA stability.
(A) Splenic B cells from Bank1+/+ and Bank1−/− mice were stimulated with 2 μM CpG for indicated time shown on the plot. Relative expression of the Il6 gene was determined using Taqman RT-PCR. Data shown is the mean ± SEM of 3 replicates from 1 out of 3 independent experiments. (B) Splenic B cells from Bank1+/+ and Bank1−/− littermate mice were stimulated with 2μM CpG for 20h followed by the addition of 1μg/mL of actinomycin D (Act D). Relative expression of the Il6 gene was analyzed with RT-PCR, and % of Il6 mRNA was determined. Data shown is the mean of 3 replicates from 1 representative experiment out of 3 performed. The thin dotted line indicates 50% degradation of Il6 mRNA. (C) Bank1+/+ or −/− splenic B cells were stimulated with 2μM CpG for the indicated times and tested by Western blot using p-MNK1/2, MNK1/2, p-eIF4E, and eIF4E specific antibodies. The data are representative of 3 independent experiments. (D) Quantification analysis of phospho-MNK1/2 and phospho-eIF4E Western blot data by densitometry. The relative intensities of phospho-MNK1/2 and phospho-eIF4E were quantified using ImageJ software (freely available through the National Institutes of Health). The plots are from 3 independent experiments and data are expressed as mean ± SD.

