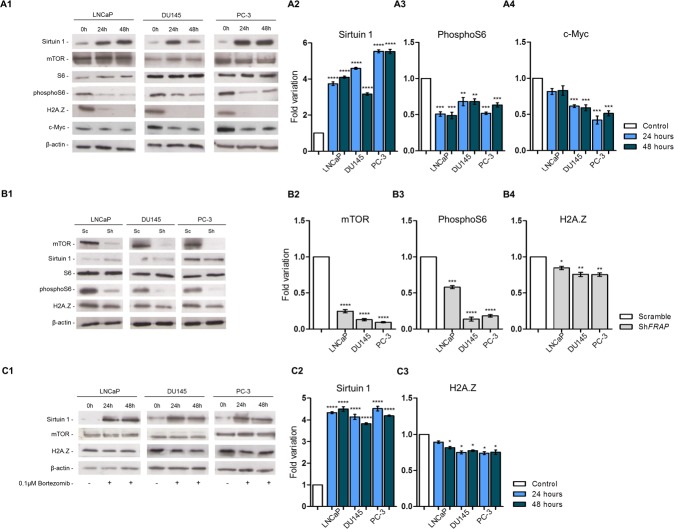
Figure 2. Protein profile of three PCa cell lines - LNCaP, DU145 and PC-3 – after (A1) SIRT1 overexpression, (B1) mTOR silencing and (C1) SIRT1 overexpression and exposure to bortezomib.
After SIRT1 overexpression levels of (A2) sirtuin 1 increased, with concomitant decrease in (A3) pS6, (A4) c-Myc and H2A.Z. FRAP silencing induced a decrease in (B2) mTOR, (B3) pS6 and (B4) H2A.Z. When SIRT1 overexpressing cells were exposed to bortezomib, the increased levels of (C2) sirtuin 1 caused a significant decrease in H2A.Z levels (C3). However, this decrease was much less impressive than previously observed for SIRT1 upregulation without proteasome inhibition. Results were normalized to β-actin and are presented as fold variation in comparison to control (mean±SD, n=3). Dunnet's test: *p<0.05, **p<0.01, ***p<0.001, ****p<0.0001.

