
Figure 5. Pharmacological inhibition or activation of sirtuin 1 promotes H2A.Z up- or downregulation.
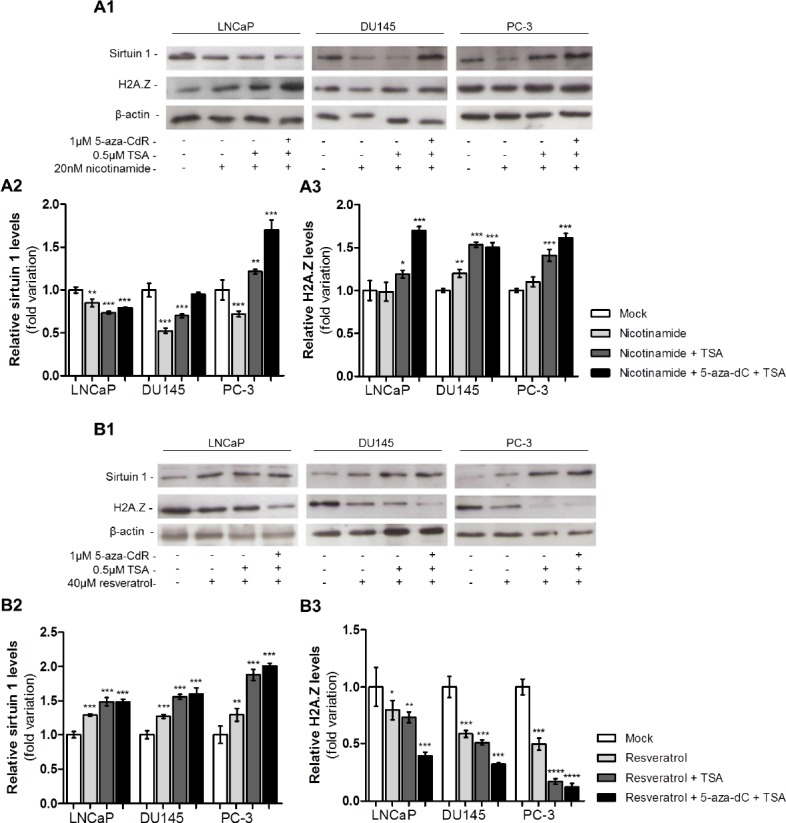
(A1) Western blot analysis of sirtuin 1 and H2A.Z of three PCa cell lines exposed to nicotinamide, alone or combined with 5-aza-dC and/or TSA. Optical densities of visible bands for (A2) sirtuin 1 and (A3) H2A.Z following drug exposure. (B1) Western blot analysis of sirtuin 1 and H2A.Z of three PCa cell lines exposed to resveratrol, alone or combined with 5-aza-dC and/or TSA. Optical densities of visible bands for (B2) sirtuin 1 and (B3) H2A.Z following drug exposure. Intensity of bands was normalized to the loading control β-actin and presented as folding variation in comparison to the untreated control (mean±SD, n=3). Dunnet's test: *p<0.05, **p<0.01, ***p<0.001.