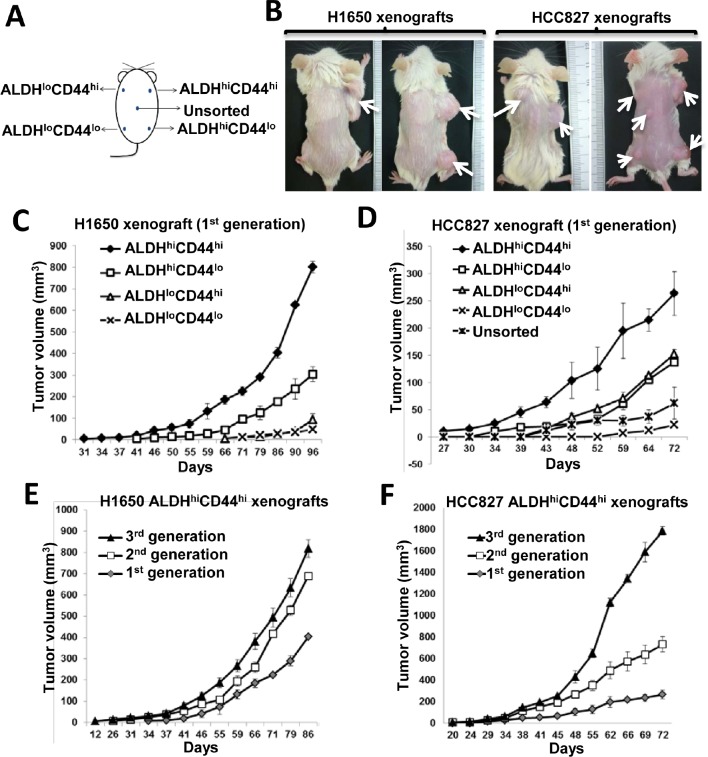
Figure 2. ALDHhiCD44hi population showed TIC properties in vivo.
A, Schematic diagram showing transplantation sites of respective ALDH/CD44 populations in SCID mice. B, Representative photographs of H1650 or HCC827 xenografts derived from respective ALDH/CD44 populations after 3 months tumor development. C and D, Tumor growth curves of 1st generation xenografts derived from 2,500 cells of respective ALDH/CD44 populations. E and F, tumor growth curves of 3 serially transplanted generations of xenografts derived from 2,500 ALDHhiCD44hi cells of respective cell lines. Data represent the mean ± SD of tumor volumes at different time points of different groups, there are 6 mice in each group.

