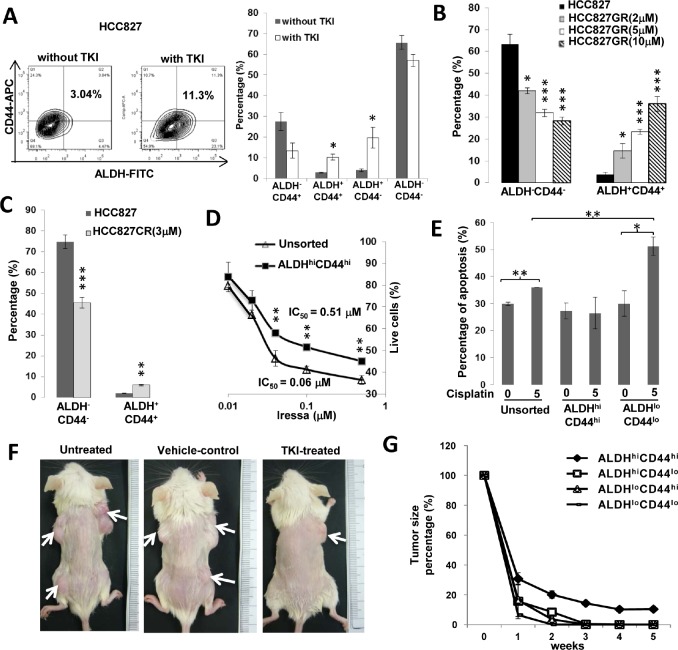
Figure 3. ALDHhiCD44hi cells showed drug resistance in vitro and in vivo.
A, Effects of 30 nM gefitinib treatment for 24 hr on ALDH/CD44 subsets of HCC827 analyzed by flow cytometry. B and C, Proportions of ALDH+CD44+ and ALDH−CD44− cells in drug-resistant HCC827 cells. Resistance was induced by chronic exposure to increasing gefitinib doses (HCC827-GR) or to cisplatin (HCC827-CR). D, In vitro cell viability response. Freshly isolated ALDHhiCD44hi and unsorted cells of HCC827 were treated with a range of gefitinib doses for 24 hr and cell viability was assayed by MTT. E, Apoptosis response. Freshly isolated respective populations and unsorted H1650 were treated with 5 μM cisplatin for 24 hr and apoptosis fractions were assayed by Annexin V/PI staining. F, In vivo xenograft response after TKI treatment. Mice bearing HCC827 xenografts from respective ALDH/CD44 subsets as depicted in Figure 2A were given intraperitoneal gefitinib 5 times per week for 5 weeks. G, In vivo tumor response curve. Tumor volumes of respective HCC827 xenografts in TKI-treated (n = 5) or control-treated (n = 3) mice were measured twice weekly. Data represent mean ± SD of tumor volume normalized to pre-treatment size in gefitinib-treated mice. *, p < 0.05; **, p < 0.01; ***, p < 0.001, compared with control treatment or unsorted cells.

