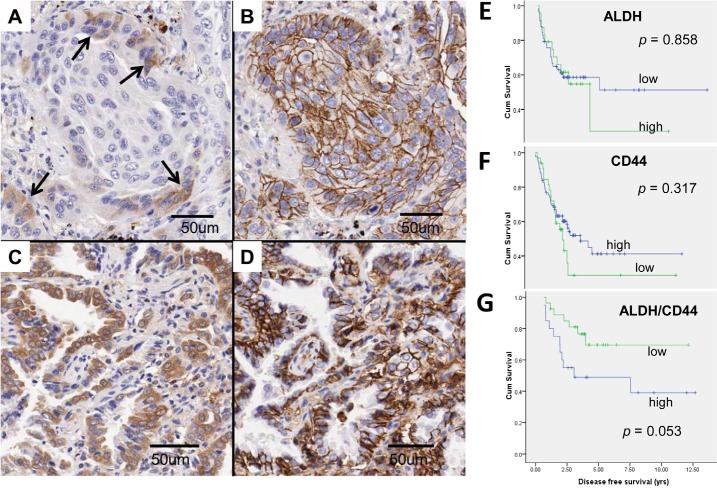
Figure 6. ALDH and CD44 expression in clinical lung cancers.
A to D, ALDH/CD44 co-expression patterns were variable in different tumors. A and B, Cytoplasmic ALDH expression (A) was observed in only a few tumor cells (→) at the invasion front of this squamous cell carcinoma while membranous CD44 expression (B) was present in all tumor cells in the same cluster. Co-localizing cells showing both ALDH and CD44 expression were few and thus graded as low abundance. C and D, This adenocarcinoma showed co-expression of ALDH (C) and CD44 (D) in almost all tumor cells and was thus graded as high abundance. E to G, Kaplan Meier survival curves comparing recurrence-free survival (RFS) in different tumor groups. For single marker analysis of ALDH (E) or CD44 (F), no significant difference in RFS was observed between tumor groups showing low or high abundance. For ALDH/CD44 dual marker analysis (G), RFS was shorter for patients with high compared to low abundance ALDH/CD44-coexpressing TIC (p = 0.053).

