
Figure 5. Effects of CCCI-01 in colony formation of cancer and normal cells.
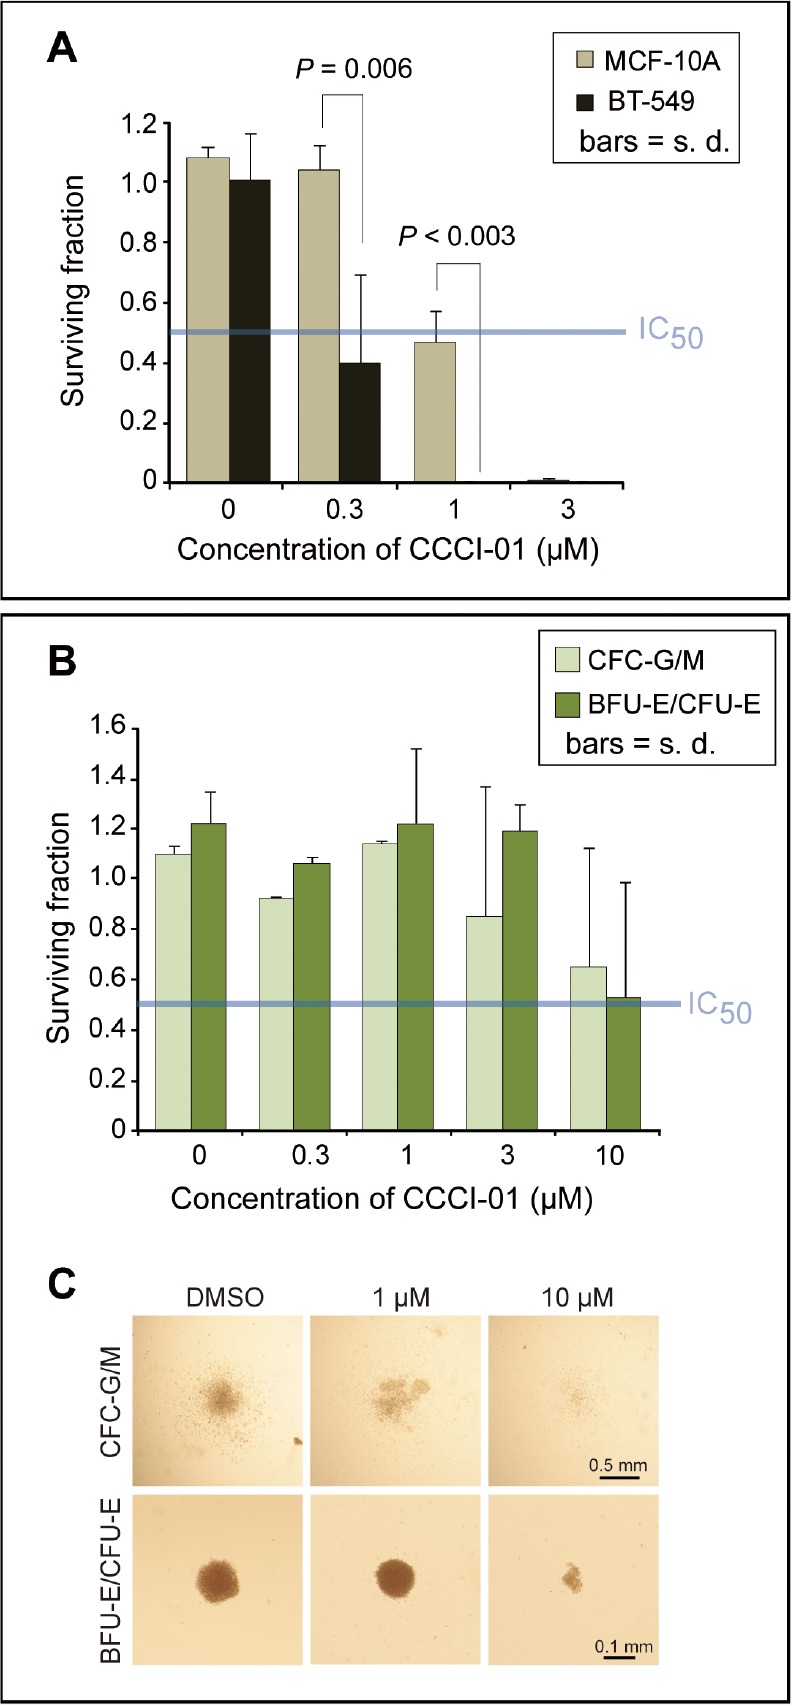
(A) Clonogenic assay was carried out in BT-549 and MCF-10A treated with CCCI-01. Colonies consisting of more than 50 cells were counted after 9 days of incubation with CCCI-01 or DMSO. All treatments received 0.06 % DMSO. Surviving fraction was obtained by normalizing to DMSO control (= 1). Values are average from at least two independent experiments. P, student's t-test. The blue line in the graph indicates IC50. (B and C) The CFC assay was carried out in primary normal bone marrow cells. Cells were cultured in the presence of varying concentrations of CCCI-01. (B) Surviving fractions of CFC-G/M and BFU-E/CFU-E colonies were obtained by normalizing to the DMSO control (= 1). Values are average of two independent experiments with two normal bone marrow samples: one is nomonuclear cells and the other is selected for CD34+. Separate data are available in Supplemental Table 1. For CFC-G/M, no inhibitory effects were detected up to 1 μM, and colony size and number were reduced in both samples at 10 μM. BFU-E/CFU-E colonies did not seem to be affected up to 3 μM, and showed inhibition in colony formation at 10 μM in both samples. The blue line in the graph indicates IC50. (C) Representative images of each type of colonies treated with different concentrations of CCCI-01.