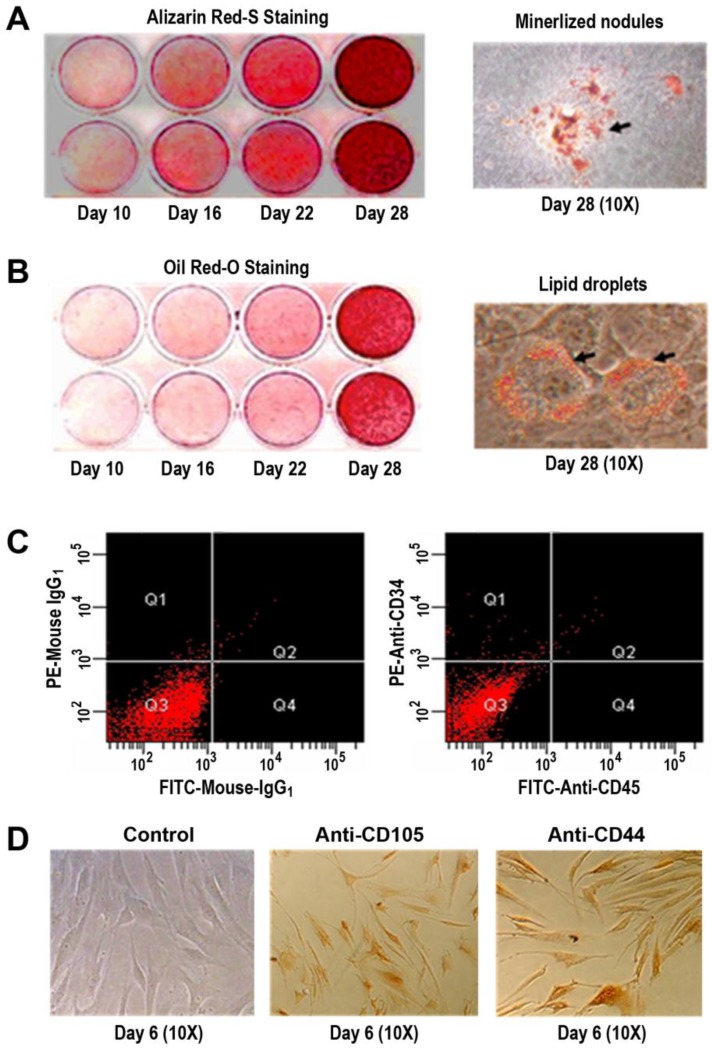
Figure 1.
Multiple differentiation potential and cell surface markers of the primary hBMSCs. (A) Alizarin Red-S staining of mineralized nodules under osteogenic condition for 10, 16, 22, and 28 days (left panel) and the images at 10x magnification of mineralized nodules at day 28 (right panel). (B) Oil red-O staining of lipid droplets under adipogenic condition for 10, 16, 22, and 28 days (left panel) and the images at 10x magnification of lipid droplets at day 28 (right panel). (C) CD34 and CD45 expressions on the surface of the primary hBMSCs by flow cytometry. Negative controls with isotype antibodies of mouse IgG1 (left panel); CD34 and CD45 expressions with PE/FITC-conjugated antibodies (right panel). (D) CD105 and CD44 expressions on the surface of the primary hBMSCs by immunocytochemistry. Negative control images by omitting the primary antibody in staining procedures at day 6 (left, 10x); Anti-CD105 staining images under identical conditions at day 6 (middle, 10x); Anti-CD44 staining images under identical conditions at day 6 (right, 10x).

