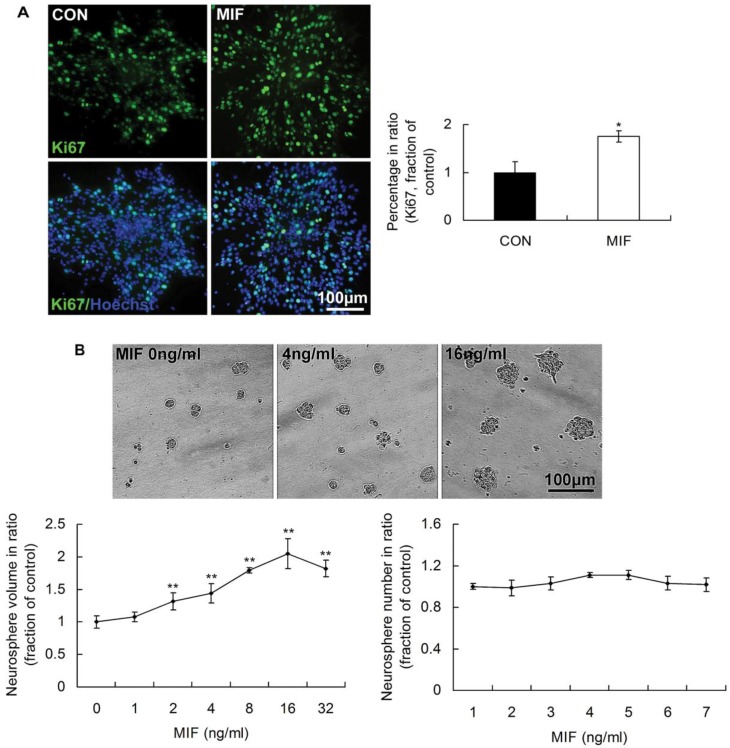
Figure 2.
The promoting effects of MIF on NSPC proliferation. A. Representative images of immunostaining show Ki67-postive cells (upper panel) and Ki67/Hoechst double staining cells (lower panel) in control and MIF-stimulated groups (MIF 16ng/ml); and the comparison of Ki67-positive cell percentages between control and MIF-stimulated groups (*p<0.05 vs. control group, n=3 animals in each group). B. Representative images show neurospheres incubated with different concentration of MIF (upper panel); and comparisons of the neurosphere volumes and numbers at different concentration of MIF by ANOVA (**p<0.0001 vs. MIF 0ng/ml group, n=6 wells in each group, repeated 3 times) (lower panel). CON, control group; MIF, MIF-stimulated group.

