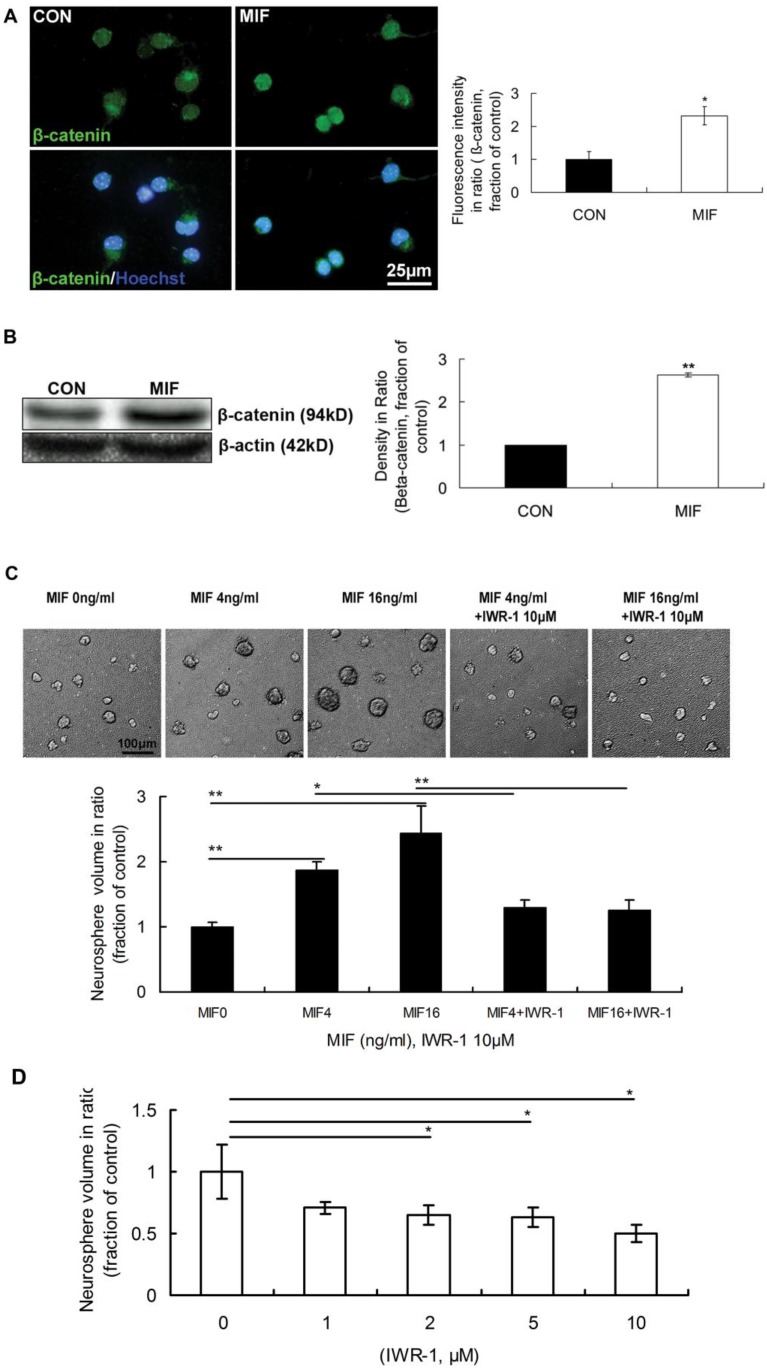
Figure 3.
The involvement of Wnt/β-catenin pathway in NSPC proliferation induced by MIF. A. Representative images of immunostaining show β-catenin-postive cells (upper panel) and β-catenin/Hoechst double staining cells (lower panel) in control and MIF-stimulated groups; and the comparison of nuclear β-catenin fluorescence intensity between control and MIF-stimulated groups (*p<0.05 vs. control group, n=3 animals in each group). B. Western blot results show the protein bands of β-catenin in NSPCs and the comparison of Western blot result showing the relative β-catenin levels in control and MIF-stimulated groups (**p<0.0001 vs. control group, n=3 animals in each group). Results were normalized to β-actin. CON, control group; MIF, MIF-stimulated group. C. Representative images show neurospheres incubated with different concentration of MIF, with or without IWR-1 (upper panel); and the comparisons of neurosphere volumes among different groups by ANOVA (*p<0.05, **p<0.0001, n=6 wells in each group, repeated 3 times) (lower panel). D. The volume comparisons of neurospheres incubated with different concentration of IWR-1 by ANOVA (*p<0.05, n=8 wells in each group, repeated 3 times)

