Figure 4.
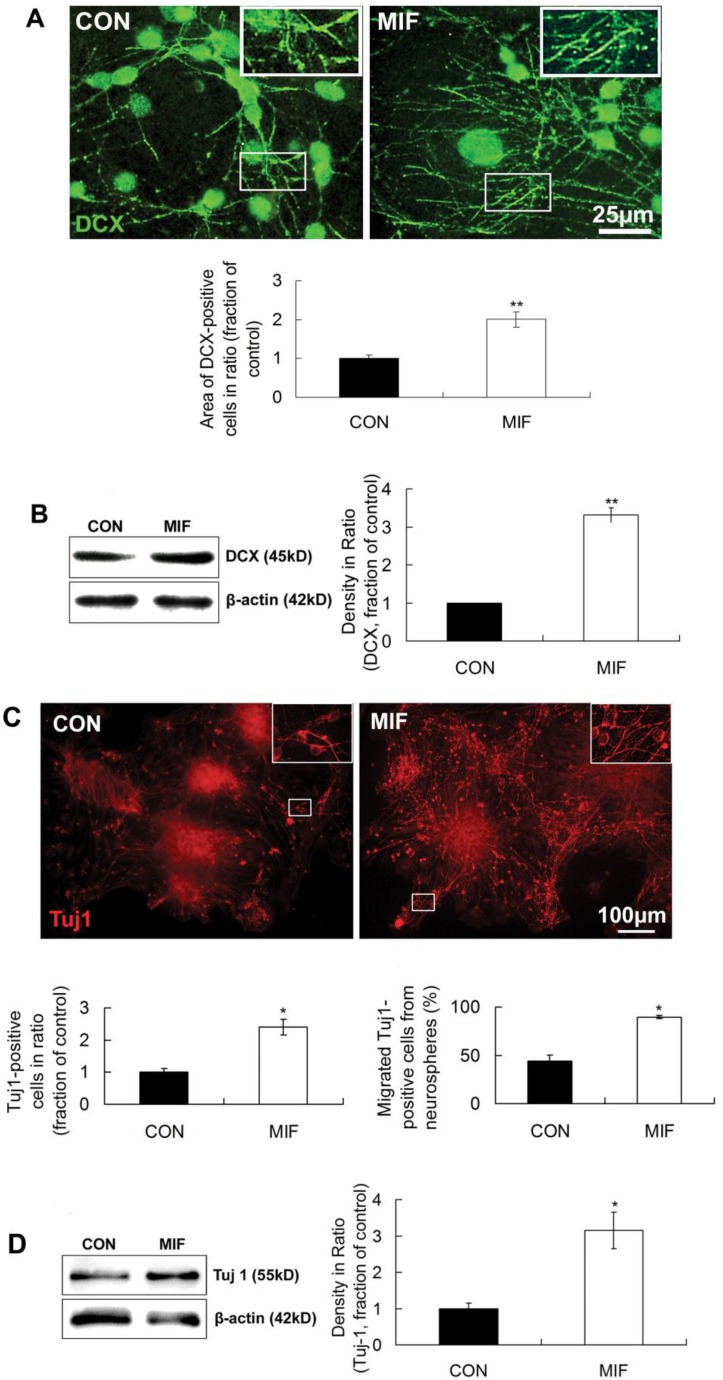
MIF promotes NSPC differentiation to neuron lineage. A. Representative images of immunostaining show DCX-positive cells in control and MIF-stimulated groups (MIF 16ng/ml) and the comparison of the areas of DCX-positive cells between control and MIF-stimulated groups (*p<0.05 vs. control group, 7 days after differentiation, n=3 animals in each group). The inserts at the top right corners are high magnification of the corresponding areas in the boxes in the images, respectively. B. Western blot results show the protein bands of DCX in differentiated NSPCs and the comparison of Western blot result showing the relative DCX levels in control and MIF-stimulated groups (*p<0.05 vs. control group, 7 days after differentiation, n=3 animals in each group). Results were normalized to β-actin. C. Representative images of immunostaining show Tuj 1-positive cells in control and MIF-stimulated groups (MIF 16ng/ml) and the comparisons of the total Tuj 1-positive cells and the Tuj 1-positive cells migrated out from neurospheres between control and MIF-stimulated groups. (*p<0.05 vs. control group, 7 days after differentiation, n=3 animals in each group). The inserts at the top right corners are high magnification of the corresponding areas in the boxes in the images, respectively. D. Western blot results show Tuj 1 protein bands in differentiated NSPCs and the comparison of Western blot result showing the relative Tuj 1 levels in control and MIF-stimulated groups (*p<0.05 vs. control group, 7 days after differentiation, n=3 animals in each group). Results were normalized to β-actin. CON, control group; MIF, MIF-stimulated group.

