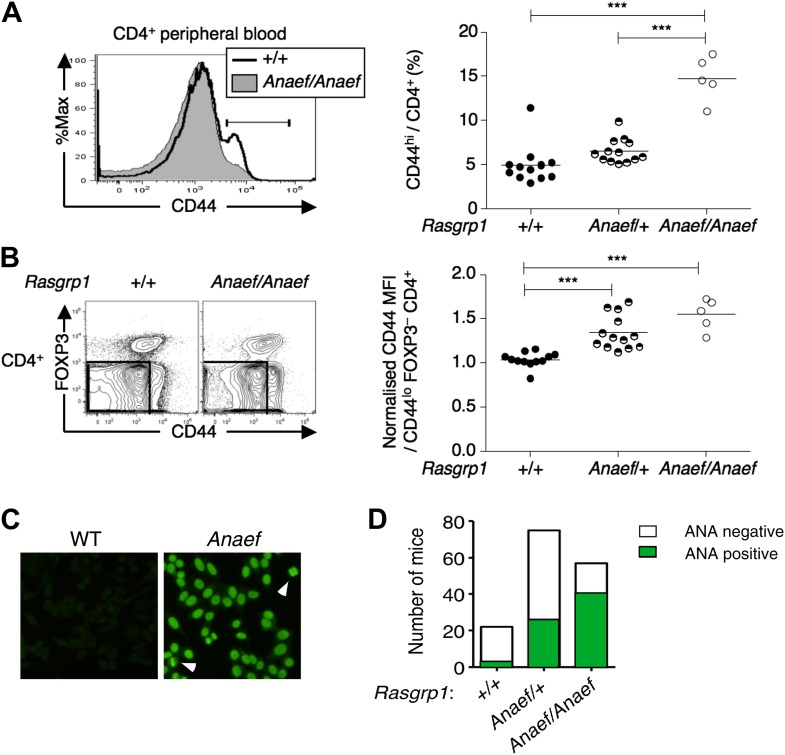
Figure 1. An ENU mouse mutant with increased CD44hi CD4 cells and anti-nuclear autoantibodies.
(A and B) Representative flow cytometry showing on peripheral blood CD4+ cells (A) CD44 expression with the gate used to define CD44hi cells and (B) FOXP3 vs CD44 phenotype including normalized CD44 Mean Fluorescence Intensity (MFI) of the gated CD44lo FOXP3− subset from Rasgrp1+/+ (WT), heterozygous Rasgrp1Anaef/+ or homozygous Rasgrp1Anaef/Anaef mice. Statistical analysis (right) used unpaired Student’s t tests where each symbol represents an individual mouse; ***p<0.001. (C) Antinuclear antibodies (ANA) in diluted blood plasma from a B6xB10. Rasgrp1Anaef mouse and wildtype littermate, measured by indirect immunofluorescence on HEp-2 cells. Note homogeneous nuclear staining of interphase cells and positive chromatin bars in dividing cells (marked with arrow). Magnification 20 ×. (D) Quantitation of positive ANA results for wildtype, Rasgrp1Anaef/+ and Rasgrp1Anaef/Anaef C57Bl/6xC57Bl/10 siblings tested at 15 weeks of age.


