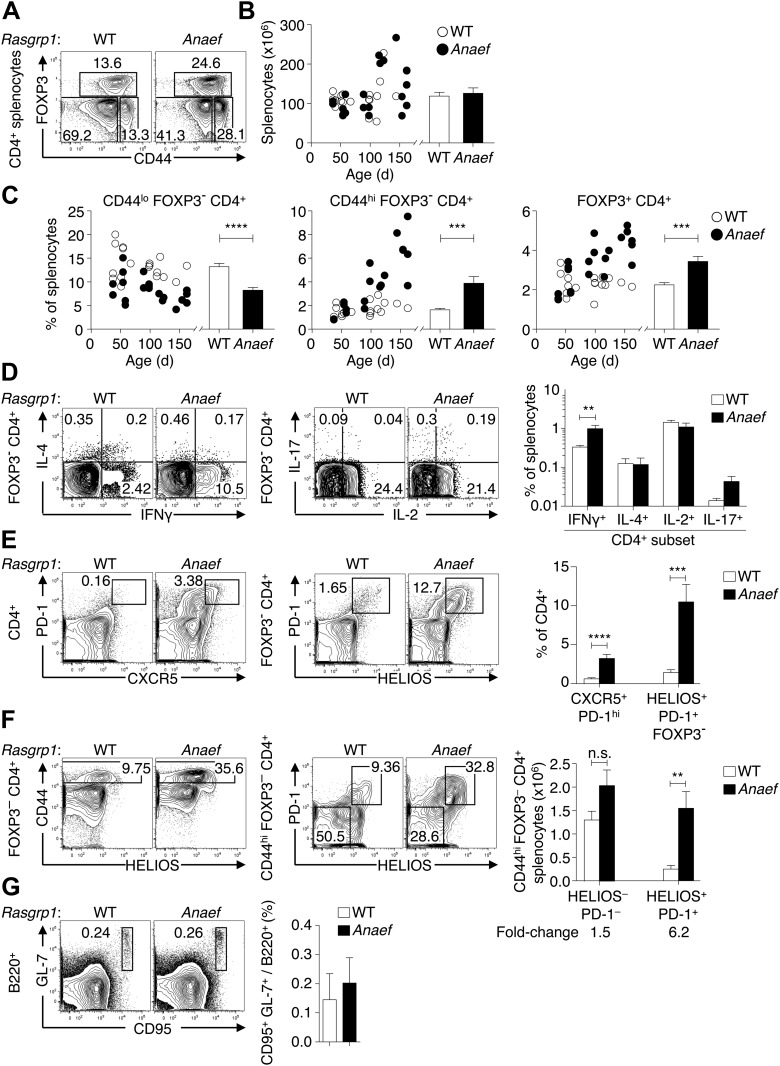
Figure 6. Rasgrp1Anaef results in dysregulation of peripheral CD4 T cells.
(A) Representative plots of wildtype or Rasgrp1Anaef CD4+ splenocytes subsetted into naïve (CD44lo FOXP3−), activated/memory (CD44hi FOXP3−), and T-reg (FOXP3+) populations. (B and C) Splenic cellularity and frequencies of the CD4+ subsets gated in (A) as a function of age in wildtype vs Rasgrp1Anaef mice; each dot represents one mouse (WT in white; Rasgrp1Anaef in black). Inset column graphs show the group mean ± SEM. Statistics obtained by unpaired Student’s t test. ***p<0.001, ****p<0.0001. (D) Representative intracellular labeling of IFNγ, IL-4, IL-2 or IL-17 on electronically gated Foxp3− CD4+ wildtype or Rasgrp1Anaef splenocytes that had been stimulated with PMA and ionomycin for 4 hr. Column graphs show mean ± SEM frequencies amongst all splenocytes. Statistical analysis of % IFNγ+ cells used an unpaired Student’s t test (n = 7 WT, 6 Anaef) **p<0.01. (E) Phenotype of CD4+ splenocytes showing a CXCR5+ PD-1hi gate for the TFH population (left) and a gate for the HELIOS+ PD-1+ population amongst Foxp3− CD4+ splenocytes (right). Column graph shows mean ± SEM frequencies of these populations amongst CD4+ splenocytes in wildtype or Rasgrp1Anaef mice. Statistical analyses used unpaired Student’s t tests (n = 19 WT, 18 Anaef). ***p<0.001, ****p<0.0001. (F) Helios vs CD44 phenotype of Foxp3− CD4+ splenocytes (left plots) showing the gate for the CD44hi population, which was analyzed for expression of Helios and PD-1 (right plots). Column graph shows the mean ± SEM number of splenocytes within the CD44hi Foxp3− CD4+ subpopulations gated in the right plots (n = 19 WT, 20 Anaef mice aged >70 days and compiled from 11 separate experiments). Unpaired Student’s t test **p<0.01. (G) Phenotype of B220+ splenocytes showing the CD95(Fas)hi GL-7hi gate used to define germinal center B cells (left), the mean ± SEM frequency of which is shown in the column graph (right) (n = 7 WT, 5 Anaef).

