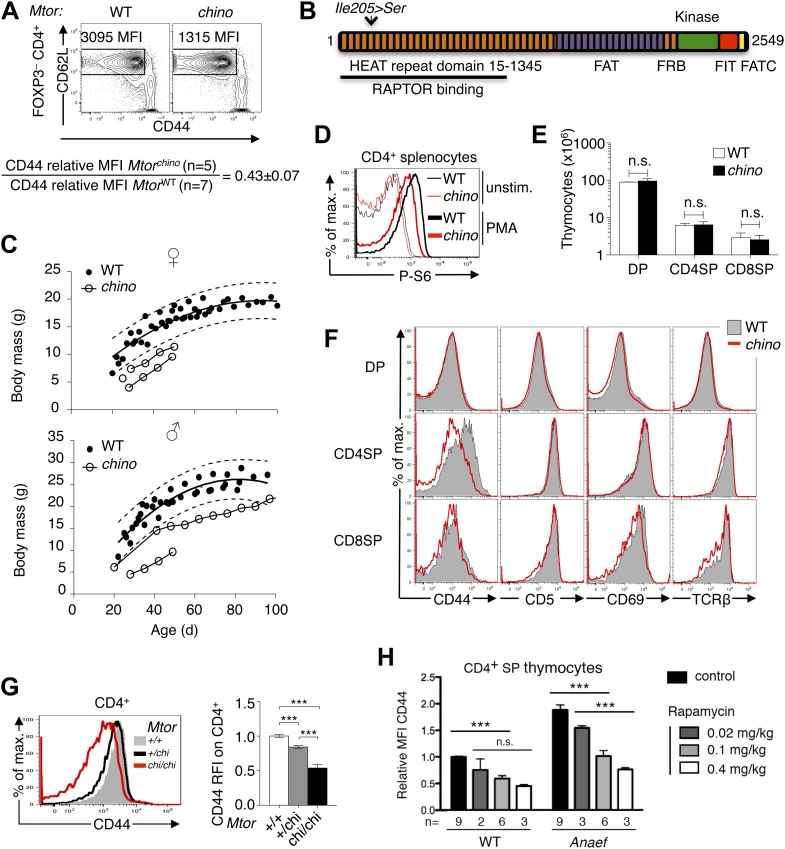
Figure 8. CD44 is a sensitive reporter of mTOR activity in immature and naïve CD4+ T cells.
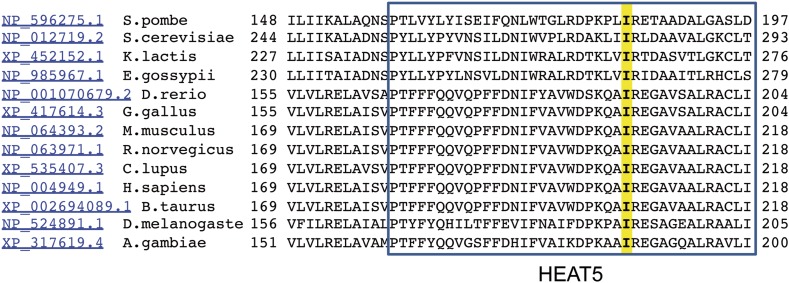
(A) CD44lo T cell phenotype upon which Mtorchino mice were identified. Phenotype of Foxp3− CD4+ splenocytes from Mtor+/+ (WT) and Mtorchino/chino (chino) mice, showing the CD62Lhi subset on which CD44 expression was quantified and normalized to the mean of WT animals (mean ± SEM from three experiments shown below). (B) Schematic of mTOR protein showing functional domains and the chino I205S mutation in the fifth HEAT repeat. (C) Reduced body size in chino. Body mass vs age of WT (black dots; 10 female [top], 11 male [bottom]) or chino (unfilled dots; three female, two male) mice. Curves were fitted to the WT datasets using second order polynomial equations; dotted lines show 95% prediction bands (the area expected to enclose 95% of future WT data points; GraphPad Prism version 5.0d for MAC OS X). Straight lines connect multiple measurements of individual chino mice. (D) Splenocytes from WT or chino mice were left unstimulated or were stimulated with PMA (100 ng/ml) for 10 min, fixed, and stained for intracellular phosphorylated-S6 (P-S6). Histogram overlay shows P-S6 staining on CD4+ cells representative of two separate experiments. (E) Number of DP, CD4SP and CD8SP cells per thymus of WT (n = 7) or chino (n = 7) mice compiled from four experiments. (F) Selective reduction in CD44 expression on chino thymocytes. Histograms show CD44, CD5, CD69 or TCRb expression on gated DP, CD4SP or CD8SP thymocytes from WT (solid gray) vs chino (red overlay) mice, representative of four separate experiments (n = 7 mice per group in total). (G) Histogram (left) and column graph (right, mean ± SEM) shows CD44 expression on CD4+ CD3+ B220− peripheral blood lymphocytes from littermate mice of the indicated Mtor genotypes, compiled from five separate experiments using a total of 20 Mtor+/+, 49 Mtor+/chi and 7 Mtorchi/chi mice. CD44 relative fluorescence intensity (RFI) was calculated by dividing by the mean for the Mtor+/+ group analyzed in the same experiment. Unpaired Student’s t tests: ***p<0.0001. (H) CD44 RFI on unstimulated CD4SP thymocytes of WT or Rasgrp1Anaef mice after 7 days of treatment with the indicated rapamycin doses. Untreated control was set at 1. ***p<0.005, n.s. = non significant.


