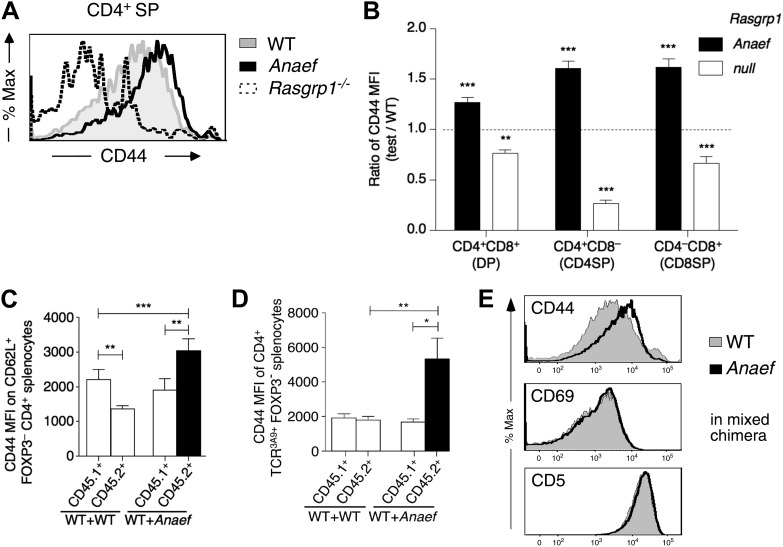
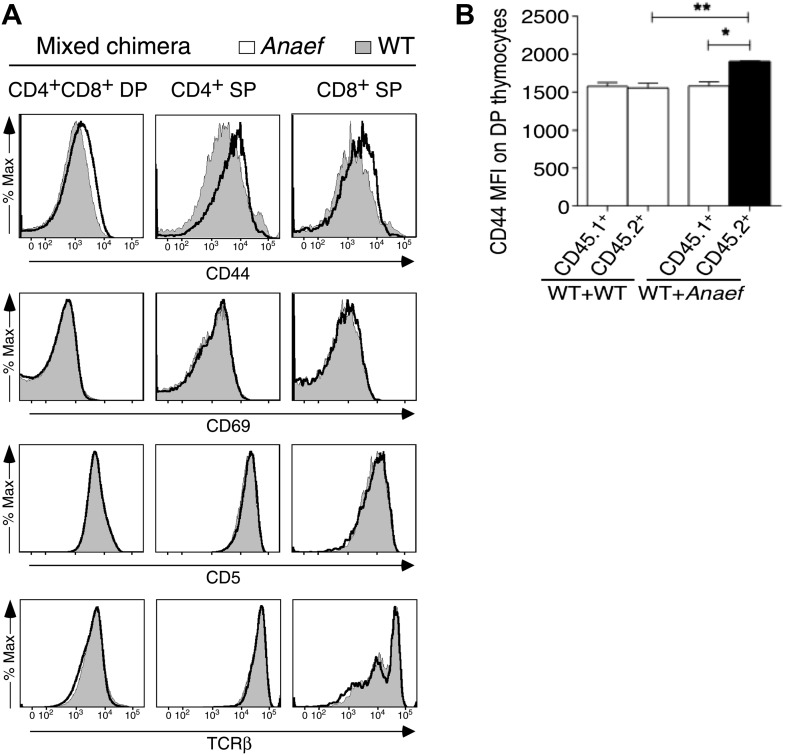
Figure 9. Selective and cell-autonomous increase in CD44 expression in Rasgrp1Anaef CD4+ T cells.
(A) Representative CD44 expression on unstimulated CD4SP thymocytes from wildtype, Rasgrp1Anaef and Rasgrp1−/− mice. (B) Mean relative CD44 from 22 Rasgrp1Anaef, 13 wildtype, and 3 Rasgrp1−/− mice compiled from seven experiments. In each experiment, the mean CD44 expression for the wildtype group was taken to be one, and values for individual mice were normalized to this. Unpaired Student’s t tests were used to compare Rasgrp1Anaef and Rasgrp1−/− with the wildtype group. **p<0.005, ***p<0.0005. (C) CD44 MFI on CD62L+Foxp3−CD4+ splenocytes from mixed bone marrow chimeras described in Figure 7F. Statistical comparisons used paired t tests within, and unpaired t tests between, groups of chimeras (n = 9 for both groups); ***p<0.001, **p<0.01. (D) CD44 MFI on TCR3A9+ (clonotype positive) CD4+Foxp3− splenocytes from B10.BR mixed bone marrow chimeras containing CD45.1+ wildtype TCR3A9 plus either CD45.2+ wildtype (n = 8) or CD45.2+ Rasgrp1Anaef (n = 7) 3A9 TCR-transgenic hematopoietic cells. Statistical comparisons in (C) and (D) used paired t tests within groups of chimeras and unpaired t tests between groups of chimeras. p value symbols: ***p<0.001, **p<0.01, *p<0.05. (E) Rasgrp1Anaef increases CD44 expression levels but does not affect CD69 or CD5 expression. CD4SP thymocytes are analyzed from irradiated mice reconstituted with non-transgenic CD45.1+ wildtype mixed with CD45.2+ Rasgrp1Anaef bone marrow.


