Figure 2.
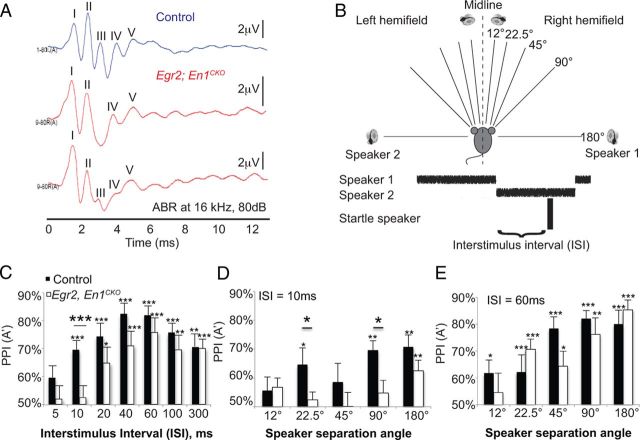
Egr2;En1CKO mice have decreased/absent ABR wave III and take longer to detect sound source switches. A, Representative ABR waveforms (16 kHz, 80 dB) of control (top trace) and two different Egr2;En1CKO mice. Note loss or reduction of wave III in Egr2;En1CKO mice with apparent preservation of waves IV and V. B, Diagram of sound localization setup. C, PPI (A′; see Materials and Methods) as a function of ISI at 90° speaker separation. Control (n = 10) and Egr2;En1CKO (n = 13) mouse responses were equivalent at ISI ≥20 ms but different at 10 ms. D, At 10 ms ISI, control mice could distinguish sound sources separated by ≥22.5°; Egr2;En1CKO mice could only distinguish sound sources separated by 180°. E, No significant differences were seen at 60 ms ISI between control (n = 10) and Egr2;En1CKO (n = 11) mice. Error bars indicate SEM. Large asterisks above lines denote differences between control and Egr2; En1CKO mice; small asterisks above error bars show differences from chance [PPI (A′) = 50%]. *p < 0.05, **p < 0.01, ***p < 0.001.

