
Figure 2.
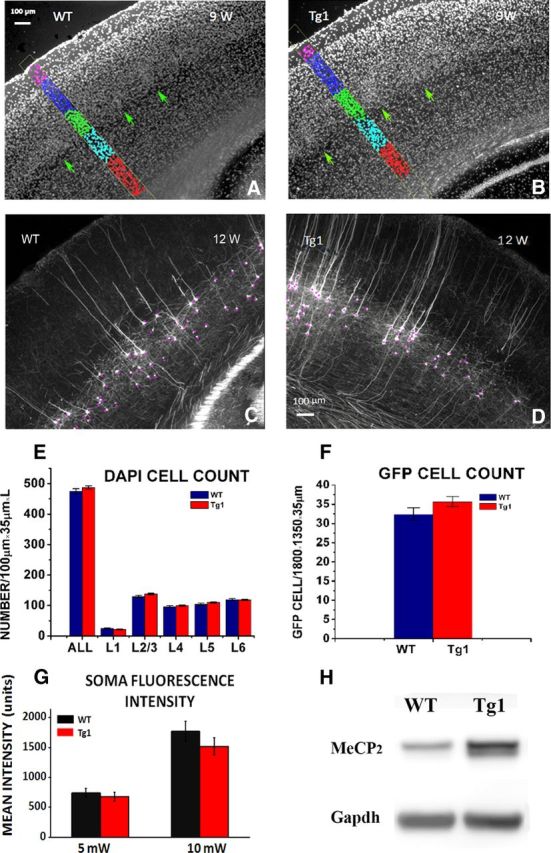
Cell number and GFP protein quantification in barrel cortex. A, B, Demonstration of cell body quantification. Thirty-five micrometer thick fixed barrel cortex sections were stained with DAPI, and cell bodies were counted in each layer within a 100 μm wide box, from three consecutive sections in 9-week-old WT (A) and Tg1 (B) mice. Barrels are indicated by green arrows. C, D, Demonstration of quantification of GFP-labeled cells. GFP-labeled cells were counted in three consecutive sections in layer 5 in WT (C) and Tg1 (D) animals. Scale bar, 100 μm. E, DAPI-labeled cell density per cortical layer in Tg1 (red) and WT (dark blue) animals. No significant difference was noted in overall cell counts at any layer. F, GFP-labeled cell density in layer 5 in Tg1 (red) and WT (dark blue). Note that there is no significant difference in GFP-labeled cell counts suggesting that there is no interaction between probability of GFP expression and Tg1 genotype. G, Average somatic fluorescence intensity at two laser power settings (5 and 10 mW) illustrating that there is no significant difference in mean somatic fluorescence and therefore in mean somatic GFP concentration in L5 neurons of Tg1 animals and controls. H, Western blots of MeCP2 protein extracted from the barrel cortex of Tg1 mice and littermate controls. Note that the MeCP2 protein levels are approximately double in Tg1 animals as expected. Statistical comparisons were made using two-way ANOVA, followed by the Tukey's multiple-comparison test.