
Figure 7.
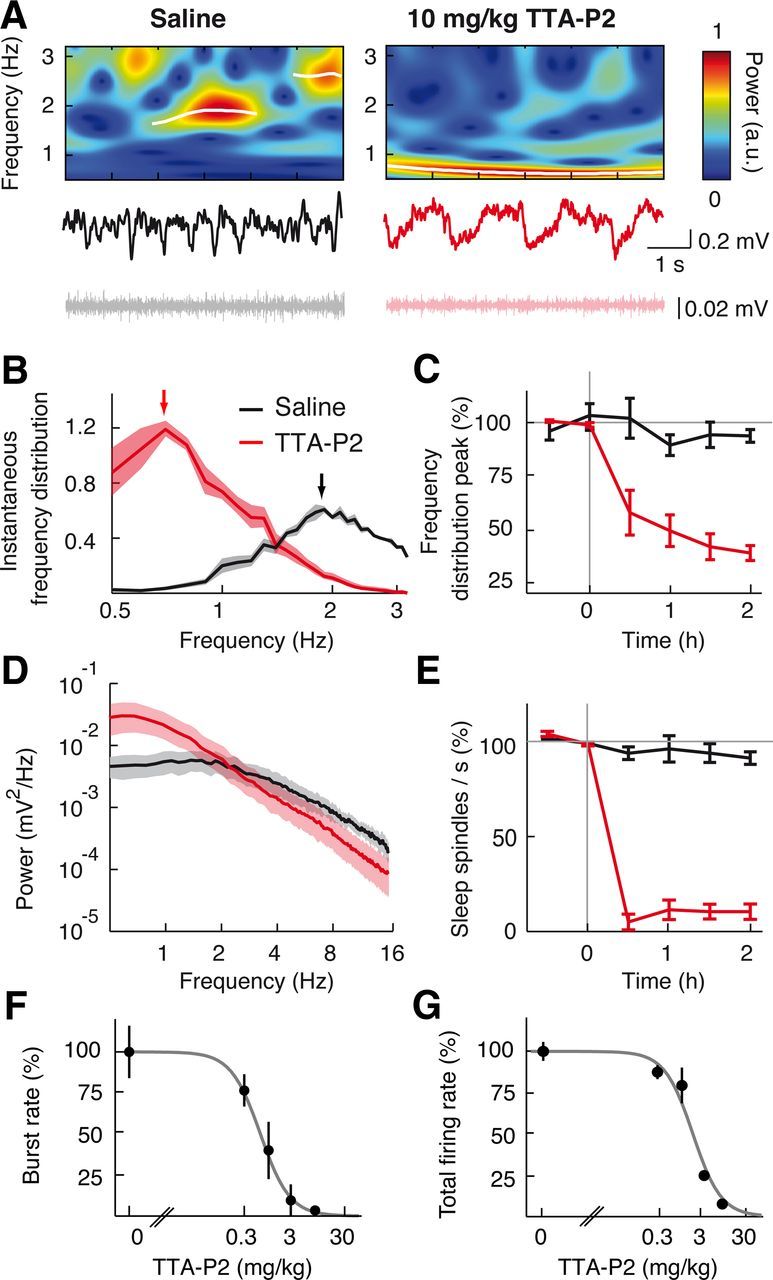
Systemic injection of TTA-P2 markedly decreases the frequency of slow waves and abolishes spindles during natural sleep. A, Non-REM sleep EEG (middle), corresponding wavelet spectra (top), and EMG (bottom) after intraperitoneal injection of saline (left) and 10 mg/kg TTA-P2 (right). Transient slow waves (white lines) were detected as ridges in the wavelet spectra as in Figure 2. B, Slow wave frequency distribution after saline and TTA-P2 injection. There is a shift of the peak (arrows) from ∼2 Hz to ∼0.7 Hz. C, Time dependence of TTA-P2 (n = 4 rats) and saline (n = 6 rats) effects on the normalized peak of the slow wave frequency distribution. D, Raw non-REM sleep EEG power spectra show TTA-P2-elicited decrease of power in sleep spindle frequency range and increase of power in slow wave frequency range compared with saline injection. E, Time dependence of TTA-P2 effects on sleep spindles normalized count. F, G, Dose–response curve of burst (F) and total spike (G) rate measured 40 min after systemic intraperitoneal injection of TTA-P2 (logistic regression fits, p < 0.05) (ED50 for bursts: 0.55 ± 0.03 mg/kg; ED50 for total spikes: 1.71 ± 0.11 mg/kg). The 3 and 10 mg/kg TTA-P2 abolish bursts recorded during natural sleep (p < 10−6 compared with saline injection, Mann–Whitney U test, n = 42 TC neurons). B, D, Solid lines indicate the mean; color shading indicates SEM. C, E–G, Error bars indicate SEM.