
Figure 4.
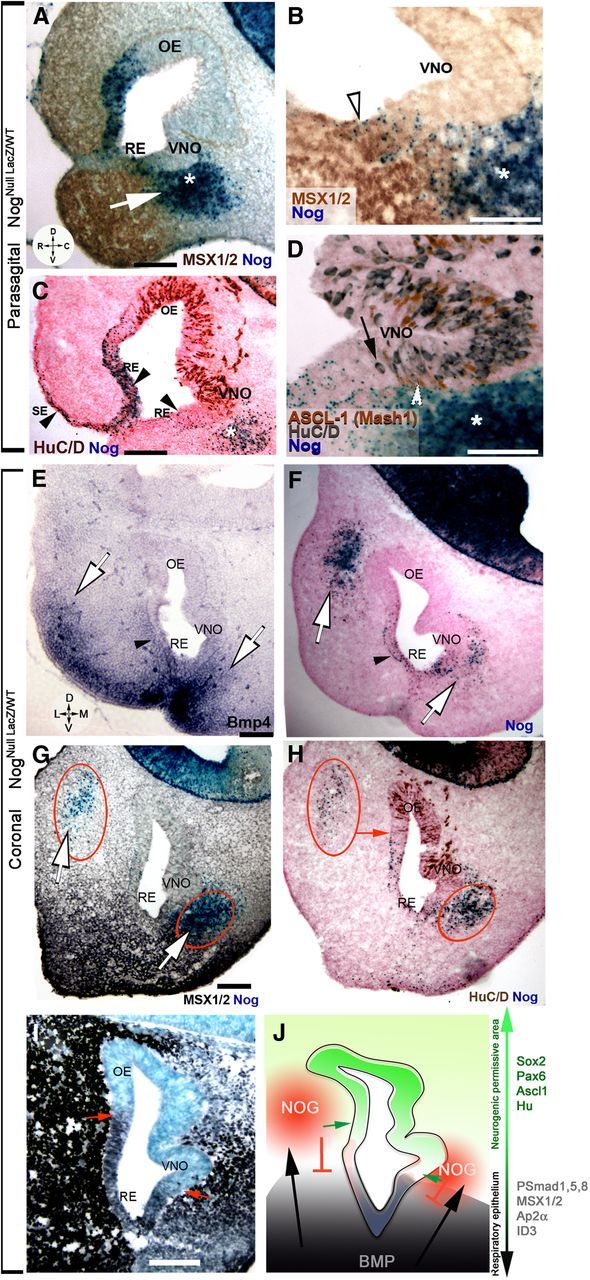
Mesenchymal sources of Nog define neurogenic permissive borders. A–F, X-gal enzymatic reaction (blue) on NognullLacz/WT. A, Msx1/2 expression (brown) decreased as Nog (blue) expression increased along the RE and in the nasal mesenchyme. White arrow depicts potential Bmp signal in inducing Nog expression. B, Nog (blue) was expressed by MSX1-positive cells (brown) along the RE while mesenchymal Nog expression defined MSX1-negative cells in the VNO. C, HuC/D immunostaining (brown) confirmed that Nog was in cells along the superficial epidermis (SE, arrowhead), non-neuronal RE (arrowheads) and in the ventral mesenchyme (asterisk). D, Vomeronasal area; immunostaining against transit amplifying progenitor cell marker ASCL1 (brown) and HuC/D (gray) showed similar expression patterns with respect to Nog sources (blue); HuC/D (black arrow) and ASCL1 (white arrowhead) were rarely in Nog-expressing areas, but were proximal to the Nog-expressing mesenchyme (asterisk). E–I, E11.5 coronal sections, orientation indicated in E. D, Dorsal; V, ventral; L, lateral; M, medial. E, In situ hybridization against Bmp4 highlighted Bmp4 sources in lateral, ventrolateral, and ventromedial mesenchyme (white arrows). Bmp4 was also expressed by mesenchyme proximal to the RE and by the RE (black arrowhead). F, X-gal staining (blue) revealed Nog expression in proximity to the lateral and ventromedial sources of Bmp4 (compare with E) as well as along the Bmp4-expressing RE (black arrowhead). G, Immunostaining highlighting MSX1 expression (black) in response to Bmp signaling in the mesenchyme and rostral RE. Nog expression (blue; red circles) was found in the dorsolateral and ventromedial nasal mesenchyme. H, HuC/D immunostaining (brown) indicated that neuron formation in the dorsolateral OE coincided with Nog expression in the mesenchyme (red arrow), while neuron formation in the VNO occurred proximal to the medioventral source of Nog (lower red circle). I, Immunostaining for the transcription factor AP2α revealed expression mainly in the non-neurogenic epithelium (use F as reference). AP2α levels decreased in proximity of the dorsolateral and ventromedial source of Nog (compare with G, H; lower red circle). J, Schematic representing relation between Bmp4 expression that induces Nog expression (red) in the nasal mesenchyme. By silencing Bmp signaling, Nog expression defines the neurogenic permissive areas of the OP. Markers related to neurogenic (green arrow) or epithelial fate (black arrow) are indicated. Scale bars, 100 μm.