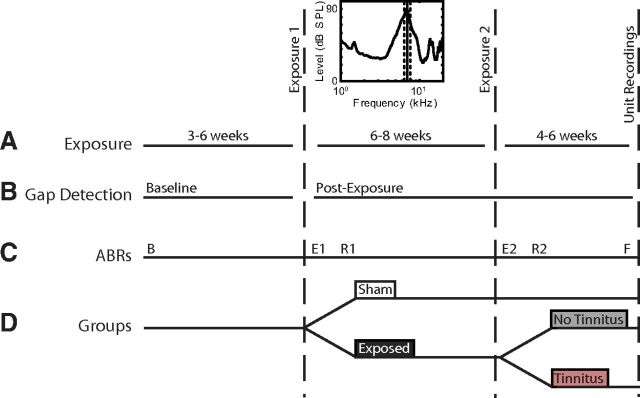
Figure 1.
Timeline describing the experimental protocol and schedule. A, Noise exposure (including noise exposure spectrum); B, gap detection testing for tinnitus; C, ABR threshold measurements; and D, the partition of guinea pigs into Sham (white), exposure (dark gray), and with (ET, gray) and without tinnitus (ENT, red) groups. B, Baseline ABRs; E1 and E2, ABRs measured immediately after exposure; R1 and R2, ABRs measured 1 week after noise exposure. F, final ABR measurements just before single-unit recordings.

