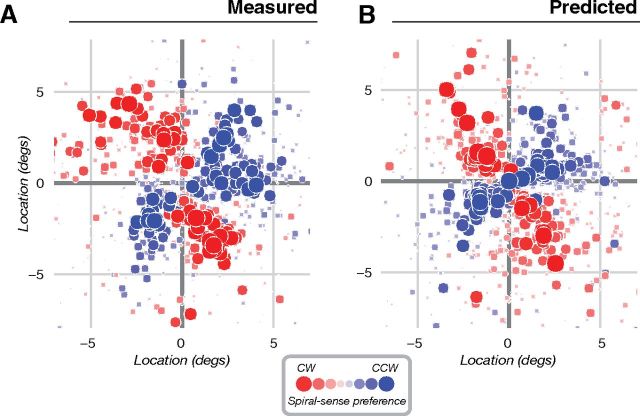
Figure 3.
Measured and predicted spiral sense preferences for an example subject (S1, same subject shown in Fig. 2). A, Measured spiral sense preference. B, Predicted spiral sense preference, computed from measurements of orientation preference and population receptive field location (see also Fig. 1B). Each point corresponds to a single voxel, plotted in the visual field based on its estimated population receptive field location. Color (red or blue) indicates the preferred spiral sense (clockwise or counter-clockwise). Symbol size and saturation indicates the difference in response amplitudes (either measured or predicted) to the two spirals. Although the experimental stimulus subtended 18° (9° radius), the plot has been cropped slightly to emphasize the region of the visual field where spiral responses were strongest.

