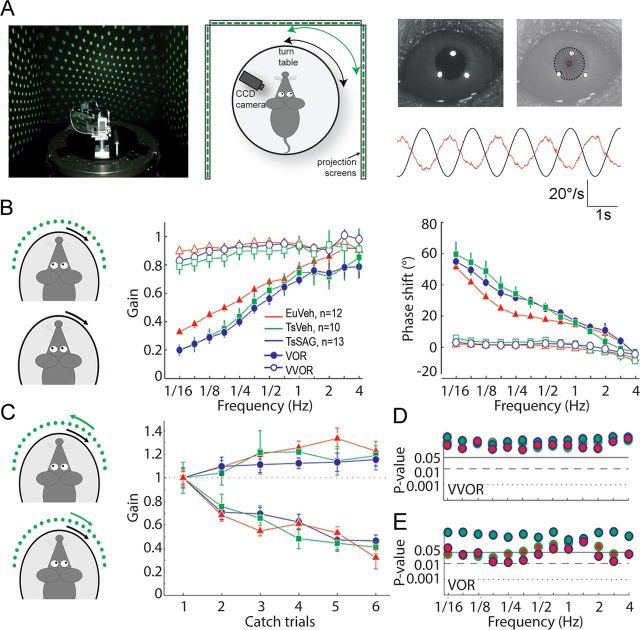
Figure 1.
Basic sensorimotor integration and short-term VOR adaptation. A, Behavioral setup with eye movements captured by CCD camera, example of corneal reflection and pupil edge detection, and a trace indicating raw eye velocity (red line) in response to vestibular stimulation (black line). B, Schematic representations of the stimulus presented for basic compensatory eye movements assessment followed by plots of gain and phase during the vestibulo-ocular reflex in the light (VVOR, open marks) and dark (VOR, filled marks). C, Representations of the stimulus used for short-term adaptation of the VOR and VOR gain changes following either increase or decrease training. D, E, P values for comparisons among group means for each frequency tested with bivariate Hotteling's T2 test. Top and bottom, Group comparisons for VVOR and VOR performances, respectively. The combination of colors indicates which groups are compared in each case. The results show unaffected basic sensorimotor integration (D) and impaired VOR adaptation (E), which is minimal in the range of frequencies from 0.5 to 1 Hz, in which the VOR adaptation paradigms are performed. Error bars represent SEM.

