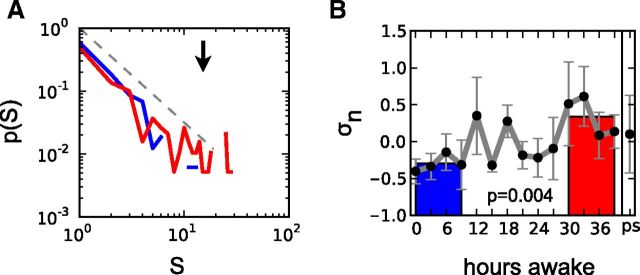
Figure 3.
Changes in the organization of neuronal avalanches identified by large deflections. As an alternative approach, neuronal avalanches were identified as large positive or negative deflections (≥±3.8 SD) at single EEG channels and combined into spatiotemporal cascades on the channel array (binning size Δt = 39 ms). A, The probability distribution of cascade sizes S follows a power-law distribution with an exponent of ≈−3/2 (gray dashed line). Curves represent combined avalanches from a subject for the first four EEG recordings (blue, 0–9 h of wakefulness) and the last four recordings (red, 30–39 h of wakefulness). A weak tendency for an increase in the distribution's tail can be observed after prolonged wakefulness (black arrow). B, Increase of the branching parameter σ during sustained wakefulness. The plot shows the average over all eight subjects. Values were transformed to z-scores in each subject before averaging over the different subjects, which is denoted by subscript n. Gray curves show the continuous measurements, the colored bars correspond to averages of the four EEG recordings at 0–9 h (blue) and at 30–39 h (red) of wakefulness; p values indicate the difference between red and blue bars (two-tailed paired t test).

