
Figure 5.
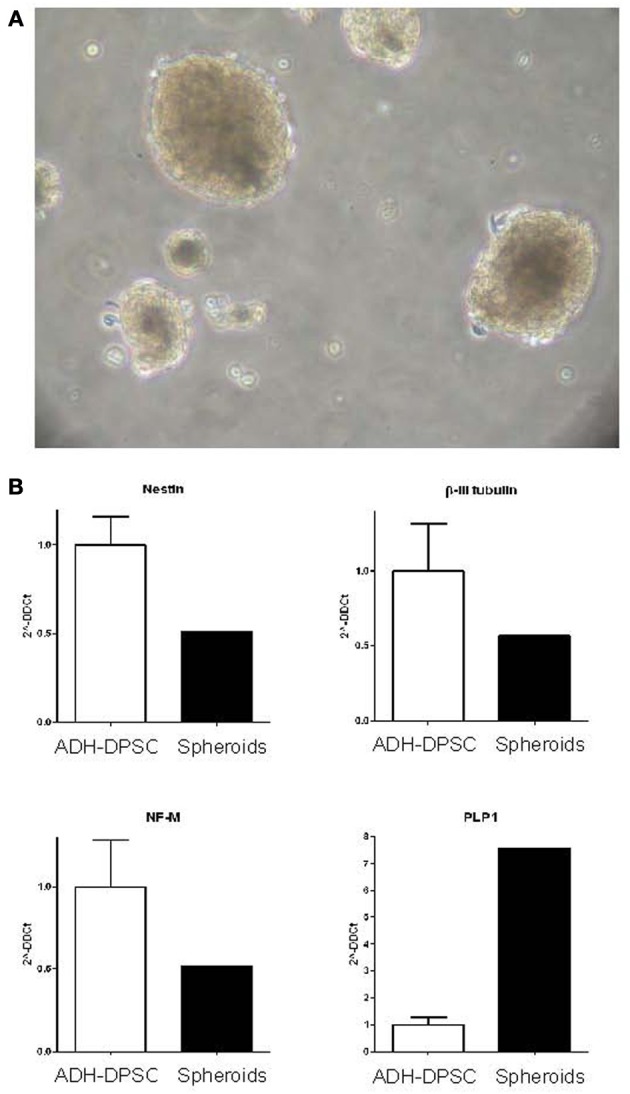
Characterization of spheroid clusters. (A) Phase contrast microscopy of the spheroid structures derived from the non-ADH cell population after 10 days in culture (Scale bars = 40μm). (B) Real time quantitative PCR of neuronal marker expression (Nestin, β-III tubulin, NF-M) and oligodendrocyte marker PLP1 expression in the spheroid structures in comparison with ADH-DPSCs.