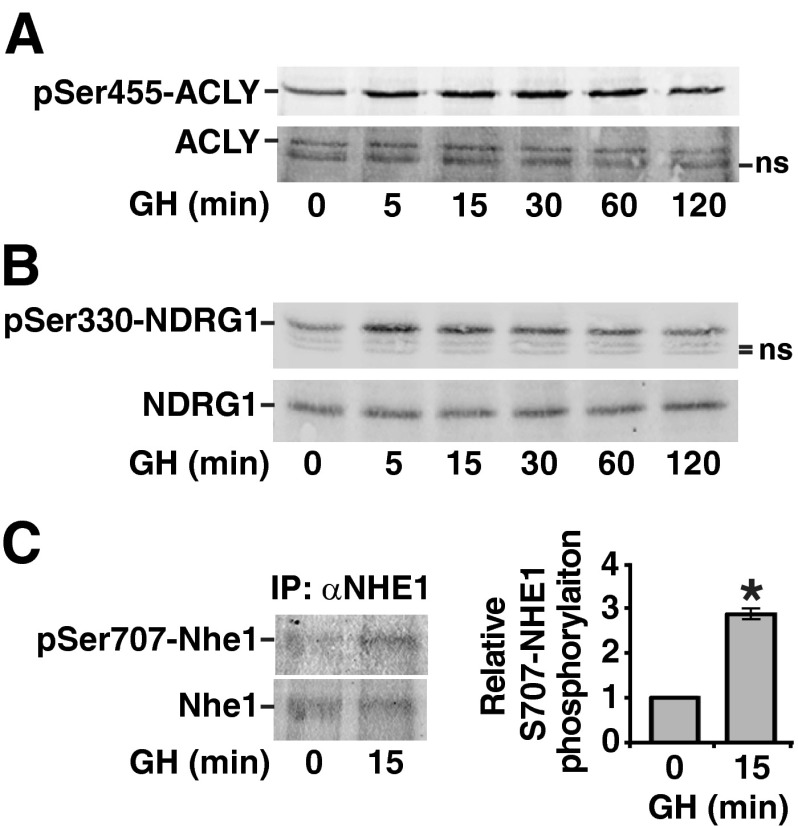
Fig. 6.
ACLY, NDRG1 and NHE1 are phosphorylated in response to GH. 3T3–F442A preadipocytes were treated with GH (100 ng/ml) (panel A), or with GH (500 ng/ml) (panels B and C) for the times indicated. A and B, Whole-cell lysates were immunoblotted with αpS455-ACLY, αACLY, αpS330-NDRG, or αNDRG as indicated. C, NHE1 was immunoprecipitated from clarified cell lysates using αNHE1 and then immunoblotted with αpS707-NHE1 and αNHE1. αpS707-NHE1 band intensity was quantified and normalized to αNHE-1 band intensity. The average intensity of three experiments ± sem was graphed, *, P < 0.05. IP, Immunoprecipitation; ns, nonspecific.

