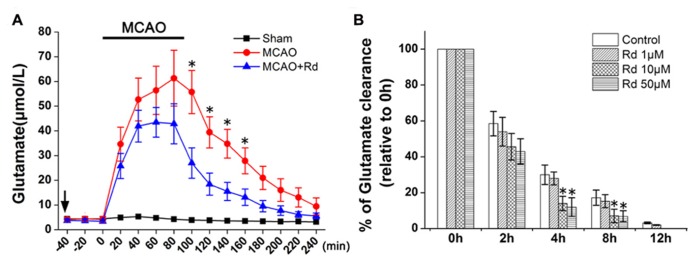
FIGURE 1.

Effect of Rd treatment on the extracellular concentrations of glutamate (A) Time course of the glutamate concentration determined with microdialysis in MCAO rats (n = 6), MACO rats pre-treated with Rd (depicted as black arrow, 30 mg/kg, n = 8) or sham-operated rats (n = 7) subjected to 90-min MCAO (depicted as the black bar) followed by 150-min reperfusion. Values are the means ± SEM. *p<0.05 vs. MCAO+Rd group. (B) Glutamate uptake was measured by indirectly quantifying the clearance of extracellular glutamate added. After 3 h of OGD, 500 μM glutamate was added to culture medium. Glutamate concentrations were measured at different time points as indicated after OGD washout. Data are expressed as mean ± SEM (n = 6). Mean values of 500 μM glutamate were scaled to 100%.*p < 0.05 vs. control group.
