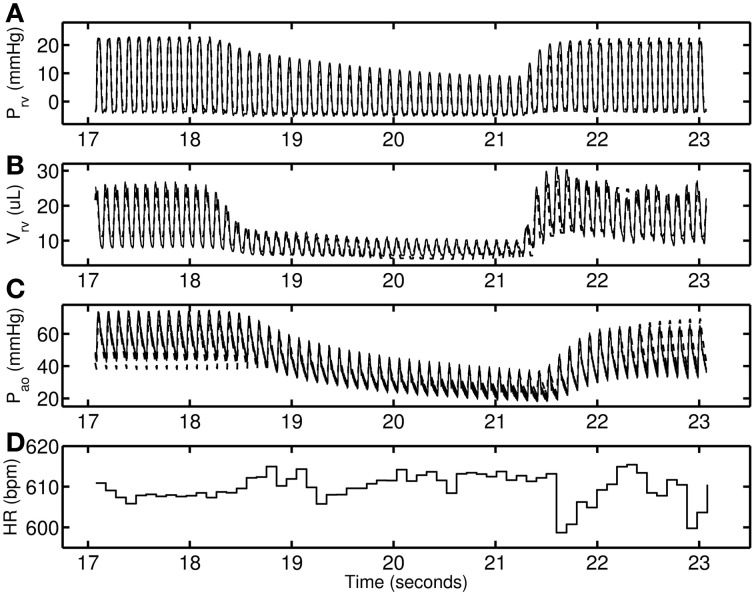
Figure 2.
A representative 0-day hypoxic mice data set (thin solid line) used for determining control parameter estimates. The model simulations are shown as dashed line. (A–C) RV pressure, RV volume, and Aortic pressure. (D) Heart-rate in beats per minute used to modify excitation—contraction of heart on a beat-to-beat basis.

