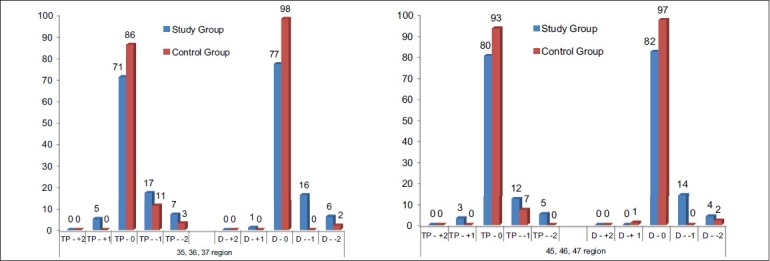
Figure 2.

Comparison of trabecular pattern and bone density changes in intra oral periapical radiograph in relation to 35,36,37 and 45,46,47 regions between patient and control groups

Comparison of trabecular pattern and bone density changes in intra oral periapical radiograph in relation to 35,36,37 and 45,46,47 regions between patient and control groups