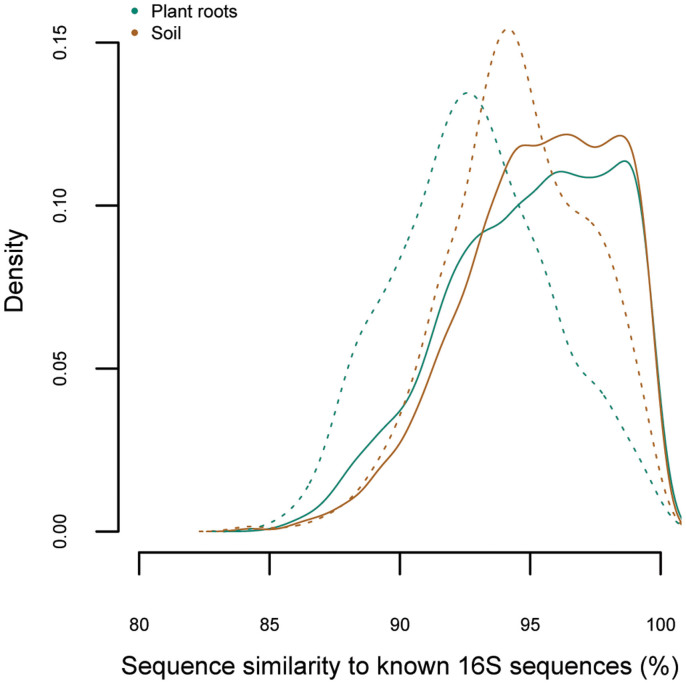
Figure 2. Density plot showing the obtained 16S sequence similarity to known GenBank 16S rRNA accessions.
The solid green line gives the density curve for all representative sequences found in plant root samples (3,571 OTUs), whereas the green dotted line gives the density curve for the representative sequences found uniquely in plant root samples (943 OTUs). The brown solid line gives the density of sequence similarity of the representative sequence of all the soil samples (3,476 OTUs), whereas the brown dotted line gives the density curve for the OTUs that were uniquely found in the soil samples (848 OTUs).

