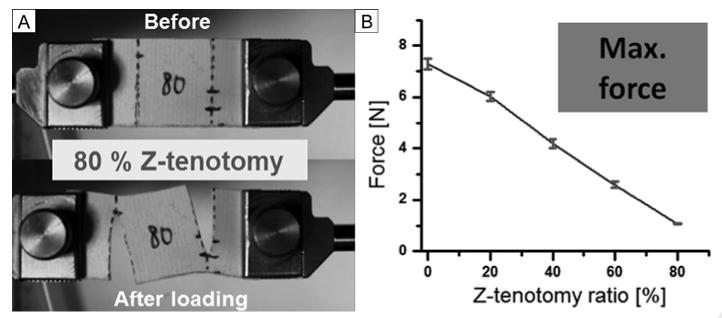
FIG 3.
Z-tenotomy of latex. A, Photographs of 80% z-tenotomy tensile testing (before and after elongation). Middle part of specimen was distorted affected by the shear force caused by Z-tenotomy and following tensile loading. B, Maximum force transition from 0 to 80% Z-tenotomy tensile testing results. Linear trend was monitored according to the Z-tenotomy ratio. Error bars indicate SD.

