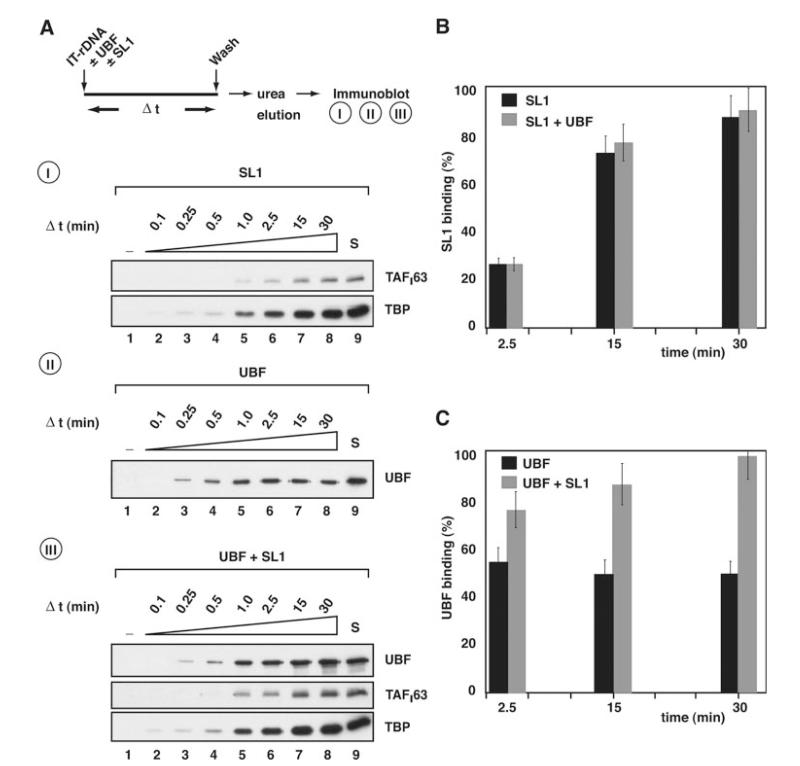
Fig. 4. Rate of association of SL1 and UBF with the rDNA promoter.
A, I, following the procedure outlined, 0.7 μg of SL1 was incubated with 10 pmol immobilized ribosomal promoter template (IT-rDNA). At 0, 0.1, 0.25, 0.5, 1.0, 2.5, 15, and 30 min (lanes 1-8, respectively) equal aliquots were removed and reactions stopped by washing templates with TM10/0.05. Template-associated proteins were then eluted with 5 m urea and analyzed by immunoblotting using antibodies specific for SL1 subunits TAFI63 and TBP. II, as for panel I, except that 0.8 μg of recombinant and purified UBF was incubated with the immobilized ribosomal promoter template. Immunoblotting used antibodies specific for UBF. III, as for panel I, except that both 0.8 μg of UBF and 0.7 μg of SL1 were incubated with IT-rDNA. Immunoblotting used antibodies specific for UBF, TAFI63, and TBP. Control lanes S (lanes 9) were loaded with 125 ng of SL1 and/or 100 ng of UBF, as indicated. B, the association of SL1 with the rDNA promoter in the absence (A, panel I) or presence (A, panel III) of UBF was quantified by measuring TAFI63 ECL signals, expressed as a percentage of the control signal S (A, panels I and III, 125 ng of SL1, lanes 9) and plotted against time (black column, SL1; gray column, SL1 plus UBF). C, the association of UBF with the rDNA promoter in the absence (A, panel II) or presence (A, panel III) of SL1 was quantified by measuring UBF ECL signals, expressed as a percentage of the control signal S (A, panels II and III, 100 ng of UBF, lane 9) and plotted against time (black column, SL1; gray column, SL1 plus UBF). Standard deviations were determined from three independent experiments for each single time point. A–C, note that the amounts of SL1 and UBF used in these binding studies were chosen because they support efficient basal and/or activated transcription in an in vitro assay, as determined by titration (data not shown).

