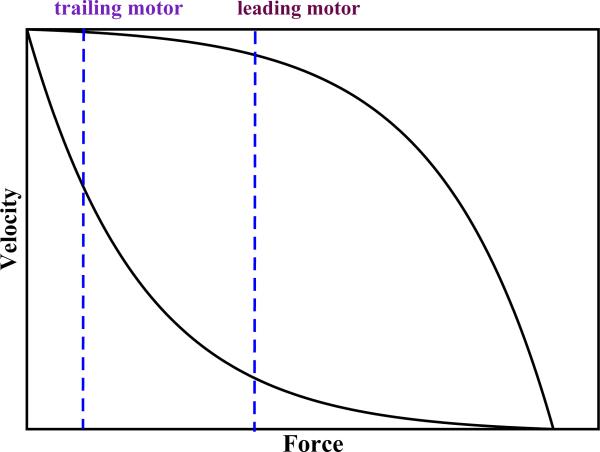
Figure 6.
Typical force-velocity curves for single motor proteins. The upper curve corresponds to strong and efficient molecular motors, while the lower curve is for weaker and less efficient motors. Vertical dashed lines correspond to forces felt by leading and trailing molecules in two-motor assemblies - see the text for more details.

