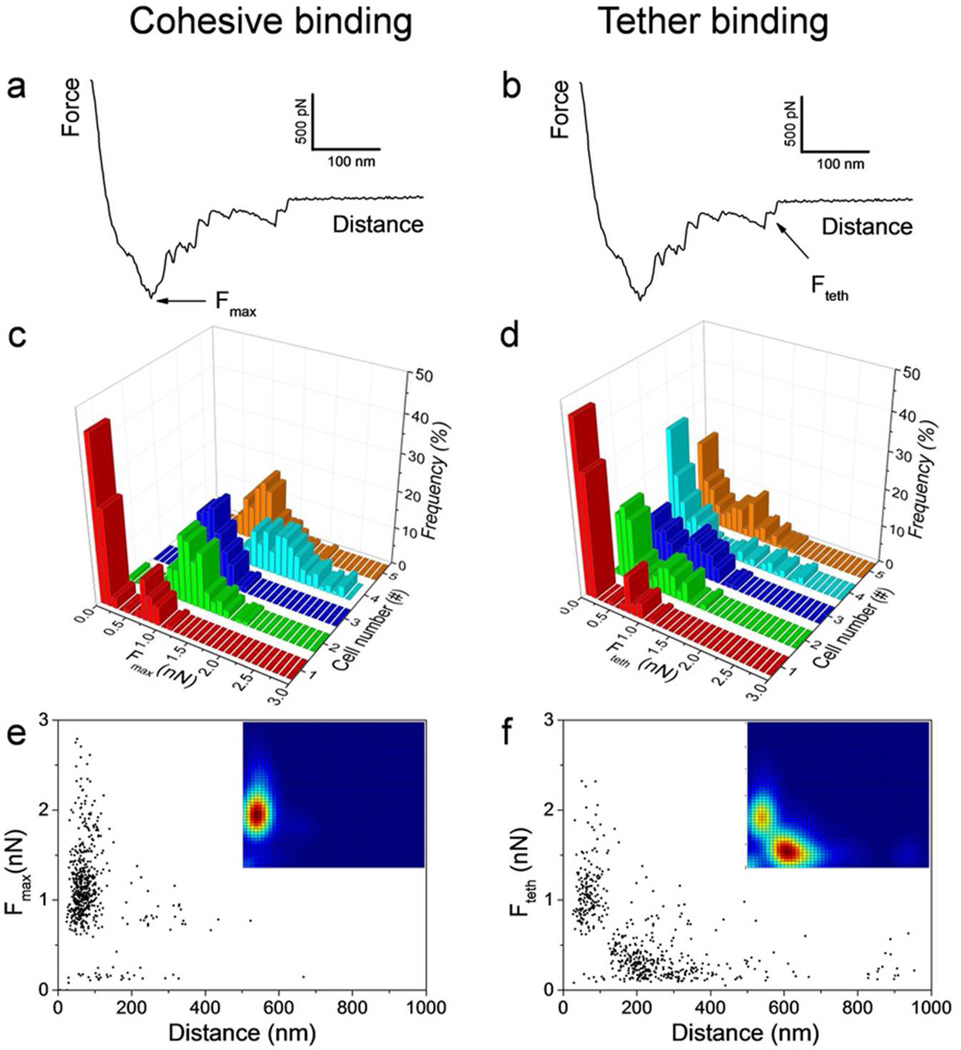
Figure 2.
Force spectroscopy of yeast-hyphae adhesion. (a, b) Representative force curves obtained for the yeast-hyphae interaction showed two characteristic features, i.e. strong, short-range adhesion force peaks (cohesive adhesion, Fmax), followed by weak, long-range force peaks (tether adhesion, Frupt). (c, d) Adhesion force histograms of the Fmax and Frupt peaks obtained for 5 different yeast/hyphae combinations (n = 100 for each combination). (e, f) Scatter plots of the adhesion force versus distance obtained for Fmax and Frupt peaks selected randomly from 5 different experiments (n = 500 data points). The insets show the corresponding bivariate color-coded maps of probability function, in which blue and red represent low and high frequency events.

