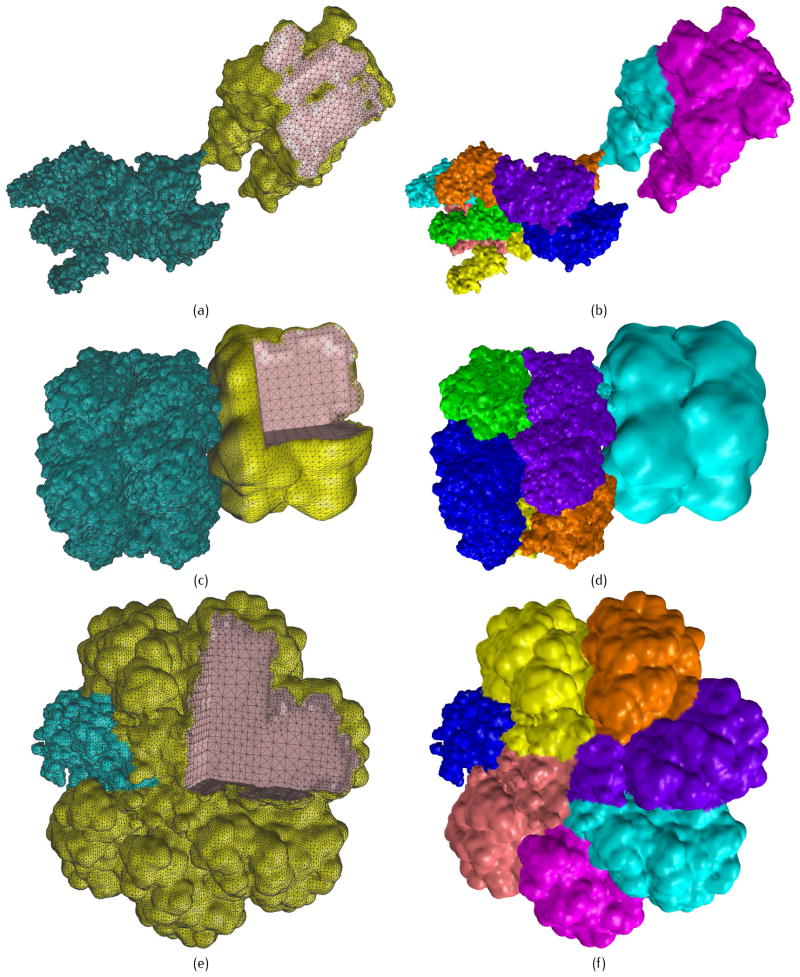
Fig 11.
Three large proteins. (a–b) 2W4A with PR = 0.2, PC = 0.8 and PR = 0.4, PC = 1.2 for low and high resolution components, respectively; (c–d) 1HTQ with PR = 0.3, PC = 0.8 and PR = 1.0, PC = 1.5 for low and high resolution components, respectively; and (e–f) 2KU2 with PR = 0.5, PC = 1.0 and PR = 1.6, PC = 2.0 for low and high resolution components, respectively. (a), (c) and (e) show tetrahedral mesh of the proteins with the blue region emphasized in high resolution, and the pink region shows a cross section of the model; (b), (d) and (f) show the partition results in parallel computation.

