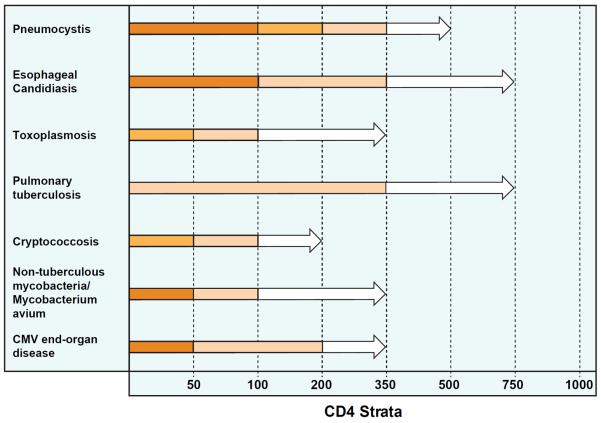
Figure 1. Incidence of select opportunistic infections stratified by CD4 count.
Data is adapted from several cohort studies of HIV positive individuals.(Anglaret et al., 2012; Minga et al., 2008; Mocroft et al., 2013; Mocroft et al., 1998; Munoz et al., 1993; Yazdanpanah et al., 2001) The bar color indicates the approximate incidence rate (IR) per 100 person-years for each respective opportunistic pathogen. Dark orange represents IR >10, orange = IR between 5 and 10, light orange = IR between 1 and 5, and white = IR <1. As CD4 counts increase, differences in the incidence rates of opportunistic infections emerge. The incidence of CMV EOD is rare when CD4 counts are >200, while the incidence of esophageal candidiasis remains moderately elevated at CD4 counts between 200 and 350, and cases of pulmonary tuberculosis continue to occur at CD4 counts >500.

