
Figure 1.
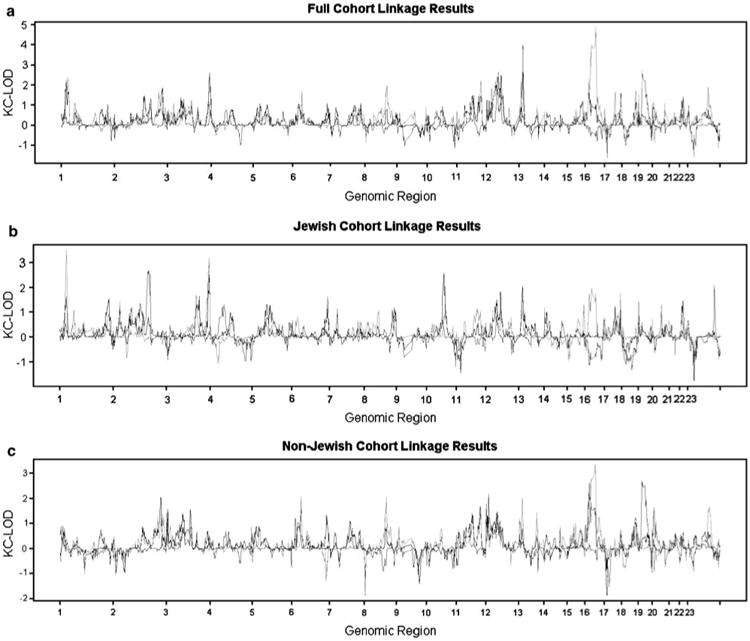
Lod scores by chromosomal regions for the full cohort (a), Jewish pedigrees (b), and Non-Jewish pedigrees (c). KC-LOD, Kong and Cox LOD score; black solid line, all IBD pairs; red solid line, CD–CD pairs; blue solid line, UC–UC pairs. See online version for color Figure.