
Figure 5.
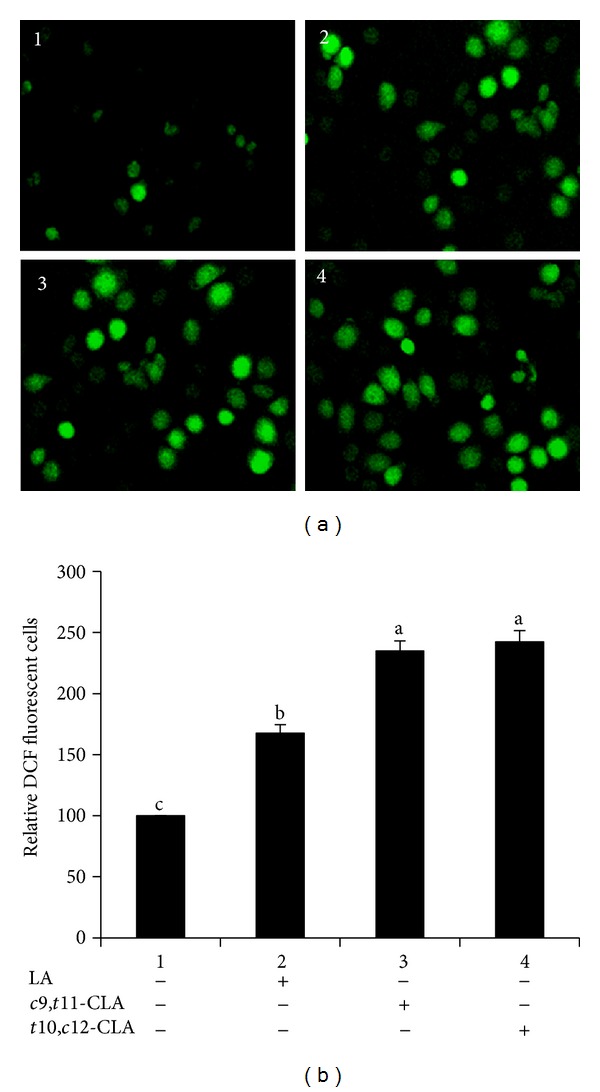
ROS generation in MCF-7 cells treated with 40 μM c9,t11-CLA, t10,c12-CLA, and LA for 48 h. (a) Representative images of cells with ROS. (b) Relative DCF-fluorescent MCF-7 cells. Values are expressed as means ± standard deviations (n = 3). Means with different lowercase letters are significantly different at P < 0.05 by Duncan's multiple-range test.