Figure 4.

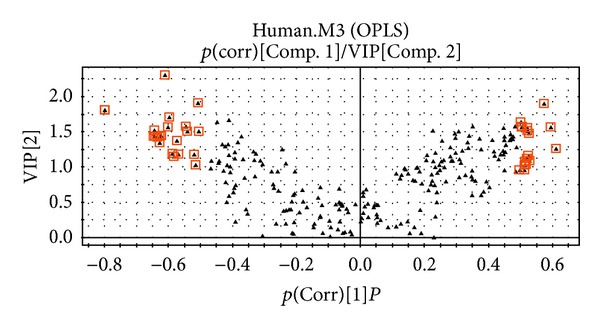
V-PLOT chart of the urine metabolomes of presbycusis patients and the control group of elderly people without hearing loss.

V-PLOT chart of the urine metabolomes of presbycusis patients and the control group of elderly people without hearing loss.