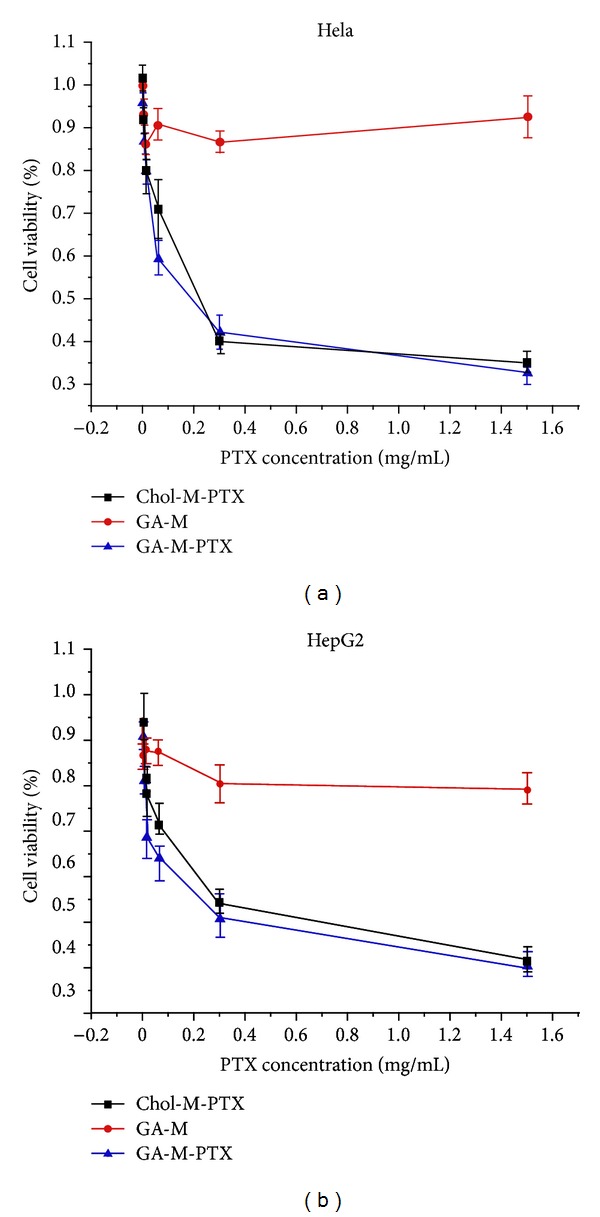
Figure 6.

Cytotoxicity of Chol-M-PTX (▪), blank micelles (•), and GA-M-PTX (▴) on Hela (a) and HepG2 (b) cell lines. The percentage of viable cells was quantified using the MTT method. Mean values and 95% confidence intervals derived from three independent experiments are shown. P < 0.05.
