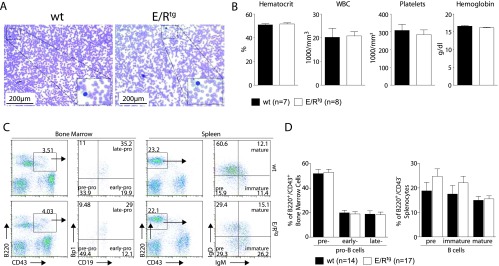
Figure 2.

Effects of ETV6/RUNX1 expression on blood physiology and B cell development. (A) Representative blood smears of 8-week-old wt and E/Rtg mice. (B) Blood parameters of wt (n = 7) and E/Rtg (n = 8) mice as measured by scil Vet ABC. Statistical analysis using unpaired t test revealed no differences. (C) Flow cytometric analysis of B cell development. Shown are representative dot plots. Different developmental B cell stages are indicated in the quadrants of the dot plots as pre, early, and late and pre, immature, and mature. (D) Statistical analysis of B cell development of wt and E/Rtg mice using Student's unpaired t test. A summary of three experiments is shown.
