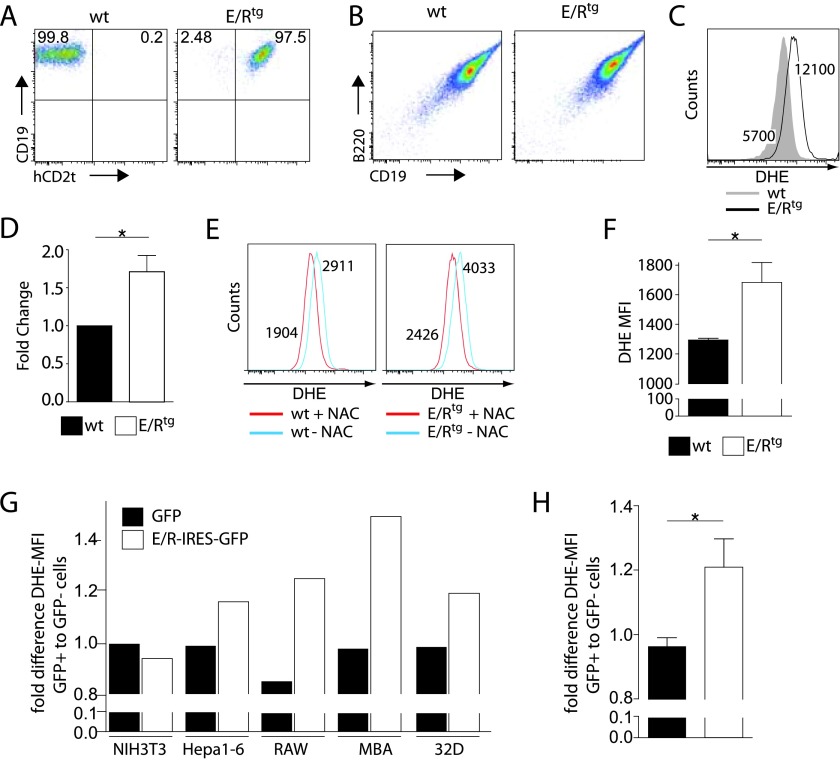
Figure 3.
E/R expression induces ROS production in vitro and in vivo. (A and B) Fetal liver cells of wt and E/Rtg mice were infected with a retrovirus encoding for p160v-ABL. Stably transformed pro-B cell lines were analyzed for the expression of the surface markers (A) CD19 and hCD2t as well as (B) CD19 and B220. (C) wt and E/Rtg cell lines were stained with DHE and subsequently analyzed by flow cytometry to measure differences in ROS level. One representative histogram is depicted. (D) A summary of all experiments using wt and E/Rtg cell lines stained with DHE is shown. Statistical analysis was carried out by one-tailed paired t test (P = .04). (E) wt and E/Rtg cell lines were treated for 24 hours with 5 mM ROS scavenger NAC and analyzed for ROS by flow cytometry. Depicted are histograms for wt (left panel) and E/Rtg (right panel) untreated cells and cells treated with NAC. (F) CD19+ BM cells of E/Rtg (n = 16) and control littermate mice (n =10) were analyzed for ROS levels. Bar graphs represent DHE-MFI ± SD; statistical differences were revealed using unpaired t test. (G) Indicated human and murine cell lines were transfected with a retrovirus encoding for E/R-IRES-GFP or GFP. The fold difference in DHE-MFI of GFP-positive versus GFP-negative cells is shown. (H) Bar graphs depict average fold change in DHE-MFI on E/R or GFP expression ± SD of all five cell lines analyzed. *P < .05 (unpaired t test).

