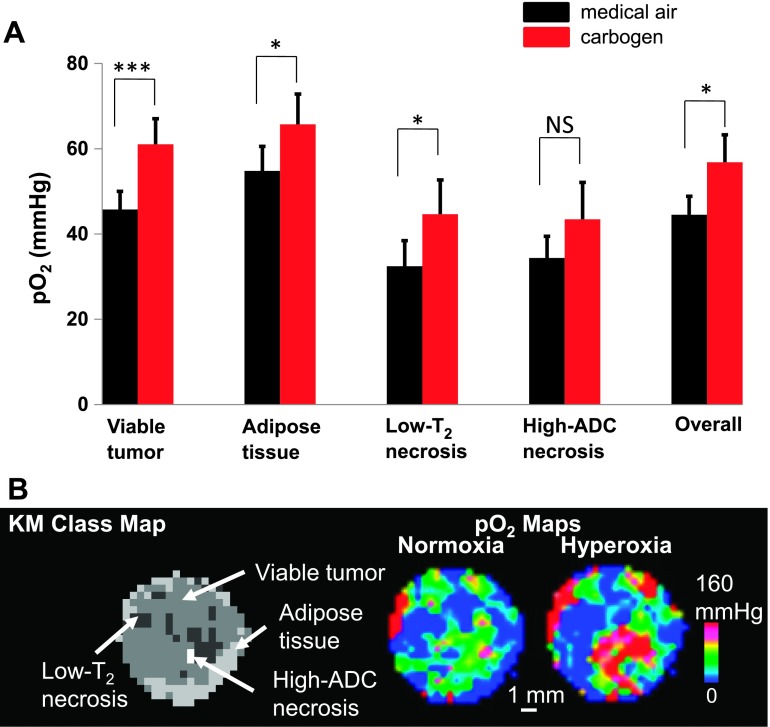
Figure 3.
The change in mean pO2 under hyperoxia challenge for the MS tissue classes. (A) pO2 data were acquired under normoxia (black) and once again under carbogen (95% O2, 5% CO2) breathing gas challenge (red). The pO2 in viable tumor class increased from 45.73 ± 4.30 to 61.06 ± 5.98 mm Hg, and the adipose tissue class and low-T2 necrosis class also exhibited a significant increase of pO2. The high-ADC necrosis class showed no change in pO2. The overall response is a weighted average of the four tissue classes. Data are shown as means ± SEM. (B) An example of a pO2 spatial map response to hyperoxia challenge. There was a heterogeneous response within the tumor, some areas increased dramatically, whereas other regions did not respond. *P < .05 and ***P < .001; NS, not significant.

