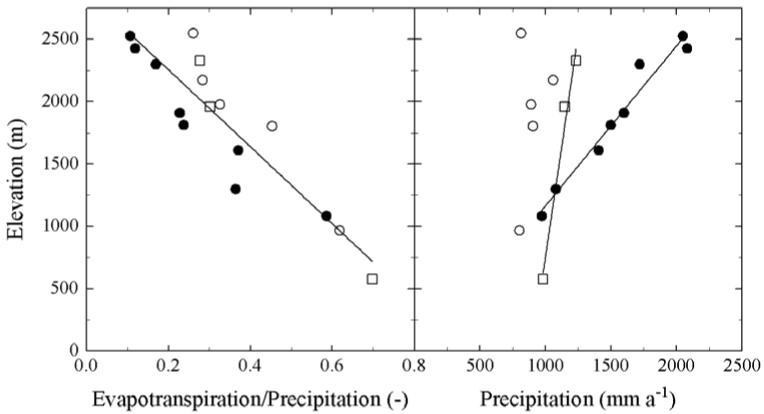
FIGURE 6. Annual evapotranspiration normalised with precipitation (left) and precipitation (right) with respect to elevation of grassland ecosystems located on the southern outer rim of the Austrian Alps (●), the inner Alpine region (○), and the Northern limestone Alps (□) between 580 and 2550 m a.s.l.
Solid lines show best fits to data using linear models (left: all data pooled; r2 = 0.83, p = 0.00; right: southern outer rim of the Austrian Alps: r2 = 0.97, p = 0.00, Northern limestone Alps: r2 = 0.98, p = 0.04).

