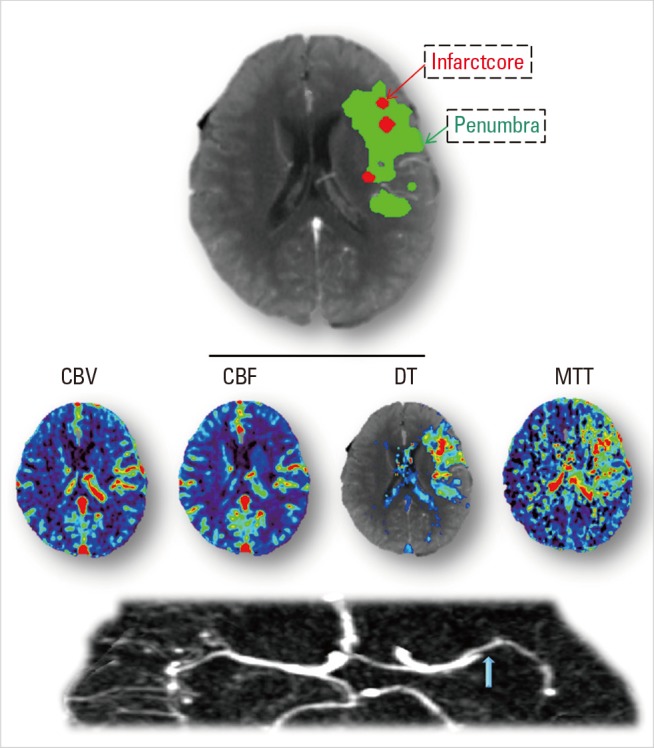
Figure 1.

Baseline brain images of Case1. Acute CTA shows occlusion of the proximal M2 segment of left middle cerebral artery (blue arrow), which results in lesions on CTP maps as prolonged MTT and DT, and decreased CBF and CBV in the left MCA territory. By setting thresholds to DT and CBF, acute CTP differentiates penumbra (green) from infarct core (red). This patient has a small infarct core with relatively big penumbra.
